

Question: Hello, i see this case solved on your site but I don't see why my balance sheet is not balancing? can you also verify the
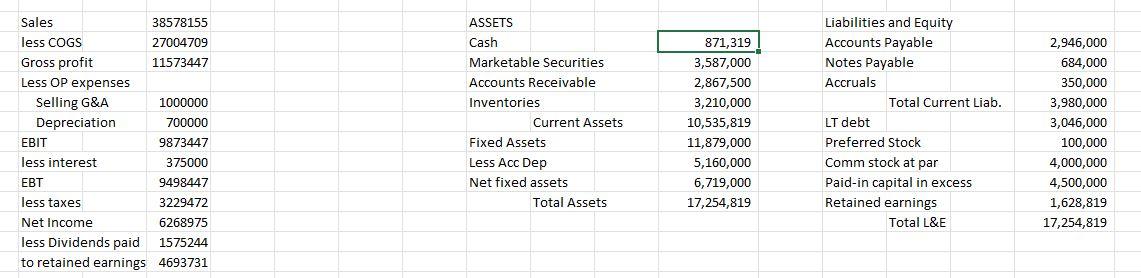 Hello, i see this case solved on your site but I don't see why my balance sheet is not balancing? can you also verify the income statement? please provide a reference to each figure to know how it was calculated/reached at. The source figures are on the left side of the sheet for which I Constructed an income statement and a balance sheet for Dec 31, 2010 attached.
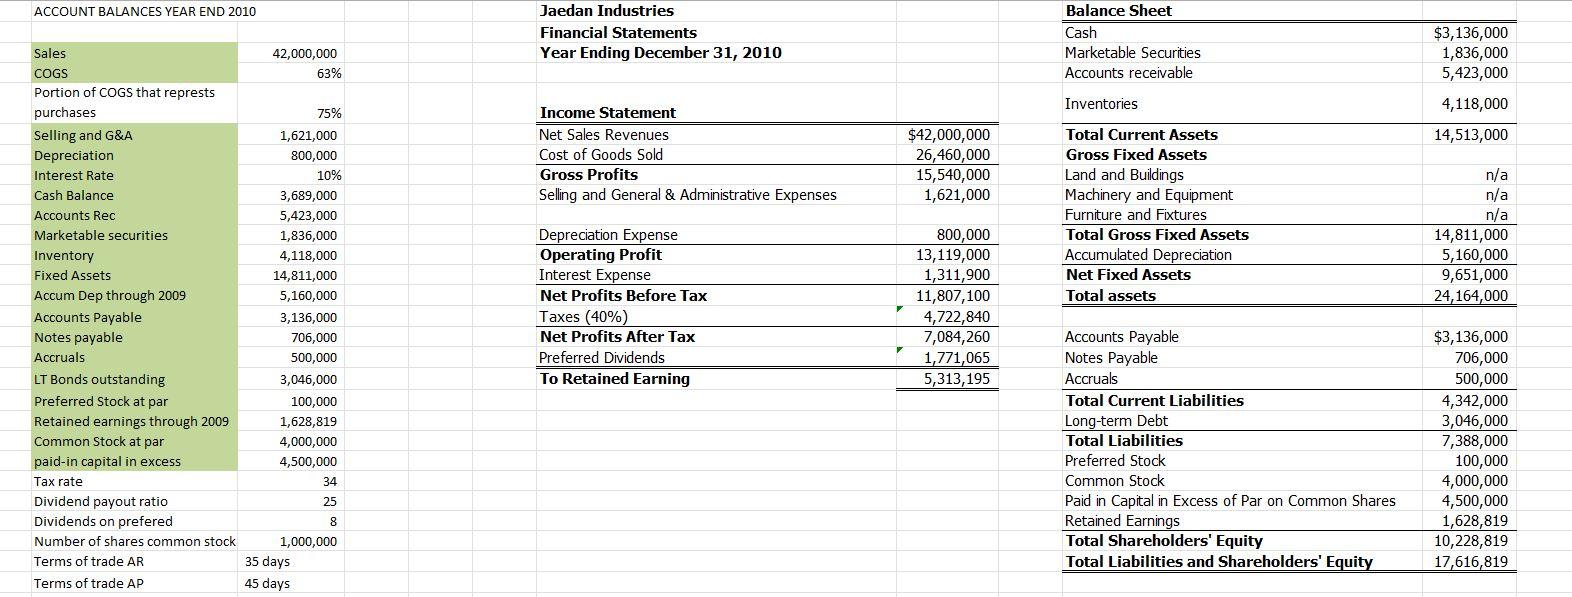
Sales 38578155 less COGS 27004709 Gross profit 11573447 Less OP expenses Selling G&A 1000000 Depreciation 700000 EBIT 9873447 less interest 375000 EBT 9498447 less taxes 3229472 Net Income 6268975 less Dividends paid 1575244 to retained earnings 4693731 ASSETS Cash Marketable Securities Accounts Receivable Inventories Current Assets Fixed Assets Less Acc Dep Net fixed assets Total Assets 871,319 3,587,000 2,867,500 3,210,000 10,535,819 11,879,000 5,160,000 6,719,000 17,254,819 Liabilities and Equity Accounts Payable Notes Payable Accruals Total Current Liab. LT debt Preferred Stock Comm stock at par Paid-in capital in excess Retained earnings Total L&E 2,946,000 684,000 350,000 3,980,000 3,046,000 100,000 4,000,000 4,500,000 1,628,819 17,254,819 ACCOUNT BALANCES YEAR END 2010 Jaedan Industries Financial Statements Year Ending December 31, 2010 Balance Sheet Cash Marketable Securities Accounts receivable 42,000,000 63% $3,136,000 1,836,000 5,423,000 4,118,000 Inventories 75% 14,513,000 Income Statement Net Sales Revenues Cost of Goods Sold Gross Profits Selling and General & Administrative Expenses $42,000,000 26,460,000 15,540,000 1,621,000 Total Current Assets Gross Fixed Assets Land and Buildings Machinery and Equipment Furniture and Fixtures Total Gross Fixed Assets Accumulated Depreciation Net Fixed Assets Total assets Sales COGS Portion of COGS that represts purchases Selling and G&A Depreciation Interest Rate Cash Balance Accounts Rec Marketable securities Inventory Fixed Assets Accum Dep through 2009 Accounts Payable Notes payable Accruals LT Bonds outstanding Preferred Stock at par Retained earnings through 2009 Common Stock at par paid-in capital in excess Tax rate Dividend payout ratio Dividends on prefered Number of shares common stock Terms of trade AR Terms of trade AP 1,621,000 800,000 10% 3,689,000 5,423,000 1,836,000 4,118,000 14,811,000 5,160,000 3,136,000 706,000 500,000 3,046,000 100,000 1,628,819 4,000,000 4,500,000 34 n/a n/a n/a 14,811,000 5,160,000 9,651,000 24,164,000 Depreciation Expense Operating Profit Interest Expense Net Profits Before Tax Taxes (40%) Net Profits After Tax Preferred Dividends To Retained Earning 800,000 13,119,000 1,311,900 11,807,100 4,722,840 7,084,260 1,771,065 5,313,195 Accounts Payable Notes Payable Accruals Total Current Liabilities Long-term Debt Total Liabilities Preferred Stock Common Stock Paid in Capital in Excess of Par on Common Shares Retained Earnings Total Shareholders' Equity Total Liabilities and Shareholders' Equity $3,136,000 706,000 500,000 4,342,000 3,046,000 7,388,000 100,000 4,000,000 4,500,000 1,628,819 10,228,819 17,616,819 25 8 1,000,000 35 days 45 days
Step by Step Solution
There are 3 Steps involved in it

Get step-by-step solutions from verified subject matter experts