

Question: Hello, I would really appreciate any help on these two problems! The first two screenshots are one problem. And the second two screenshots are the
Hello, I would really appreciate any help on these two problems! The first two screenshots are one problem. And the second two screenshots are the second problem.
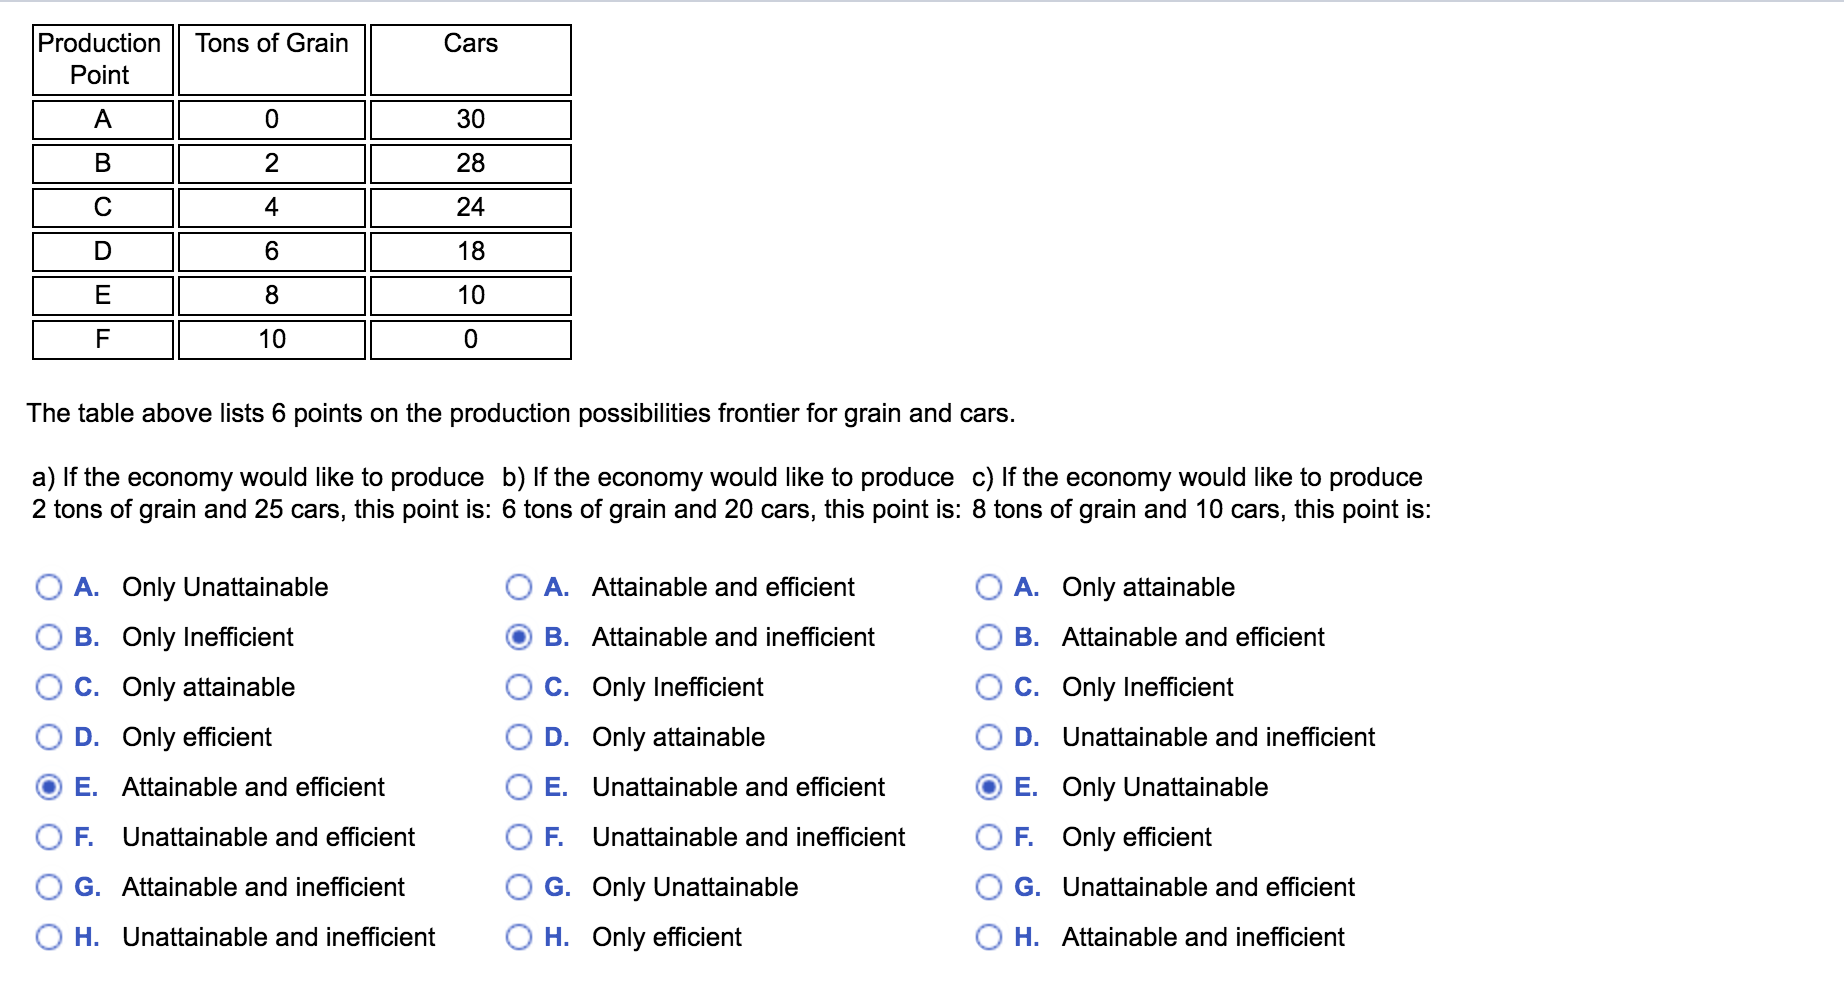
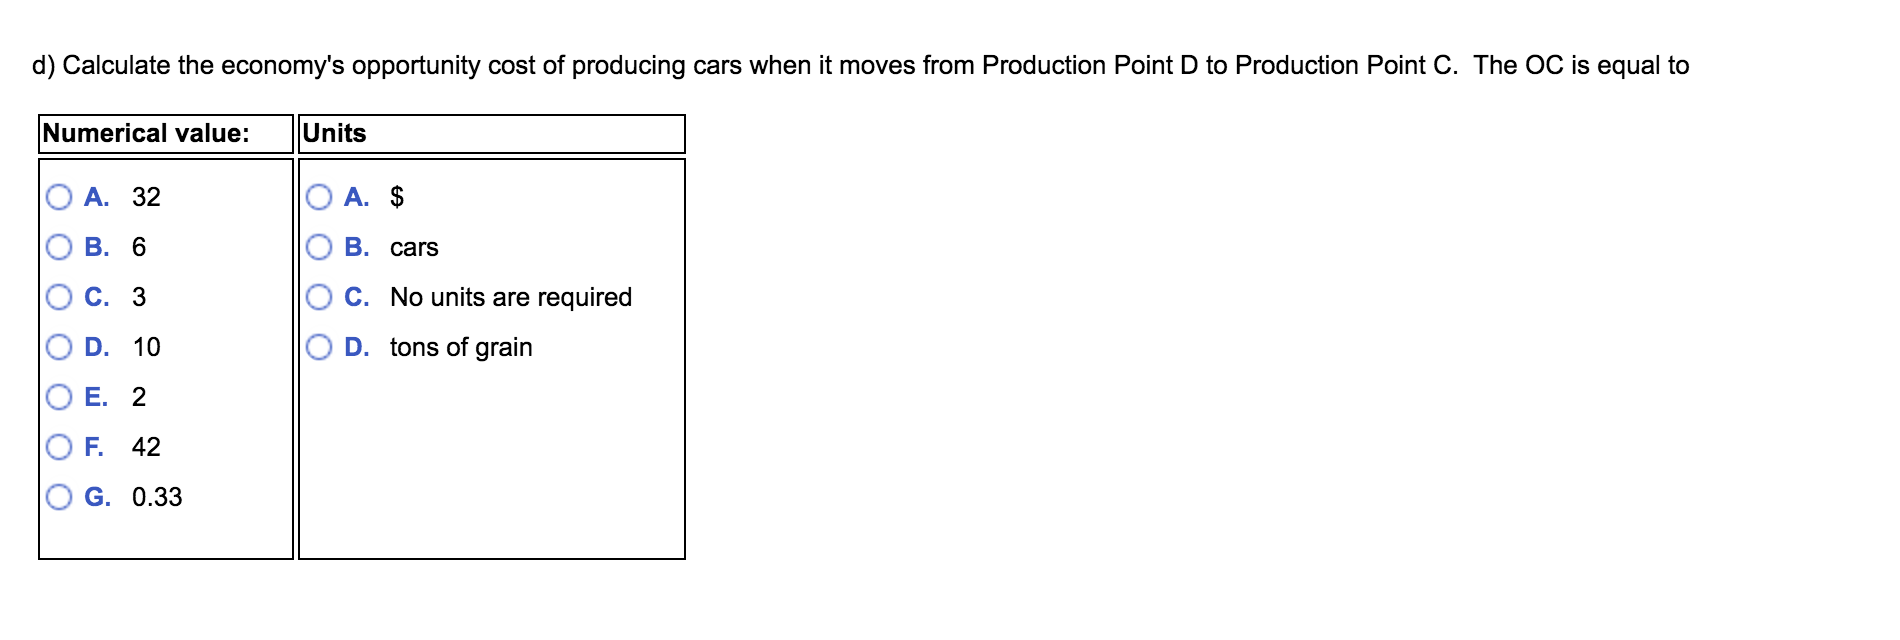
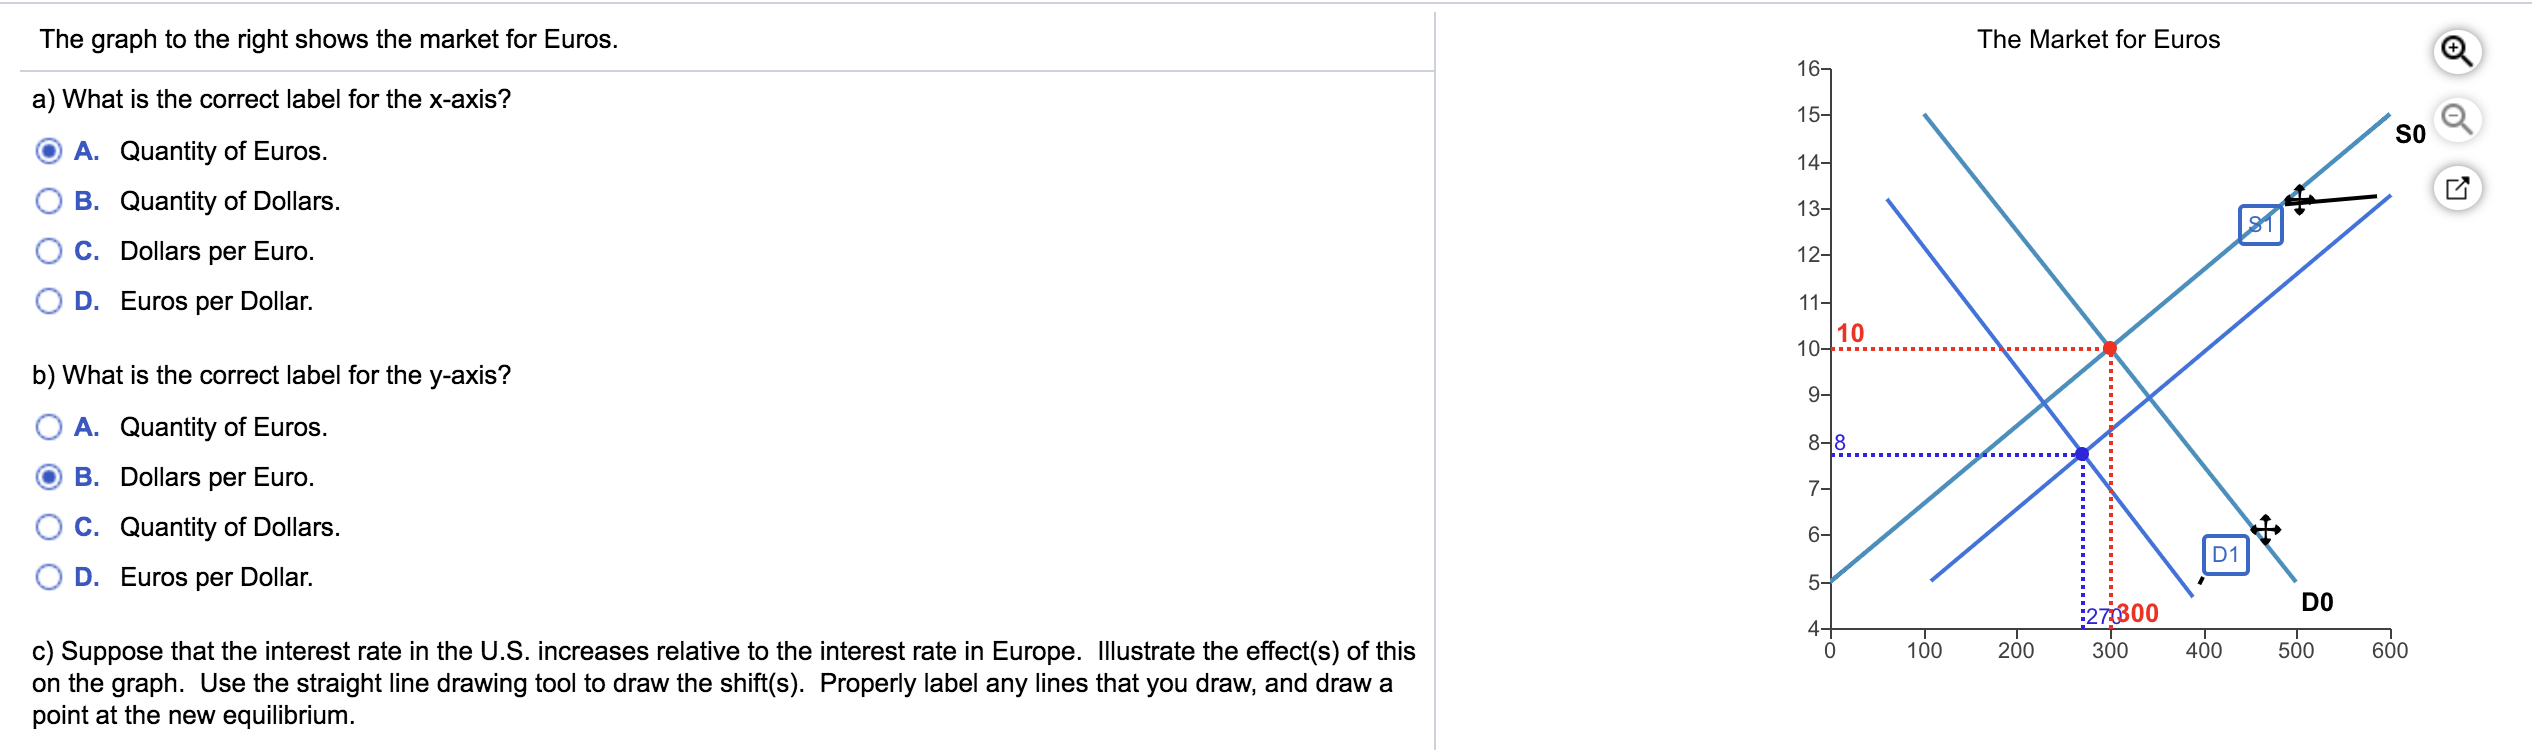
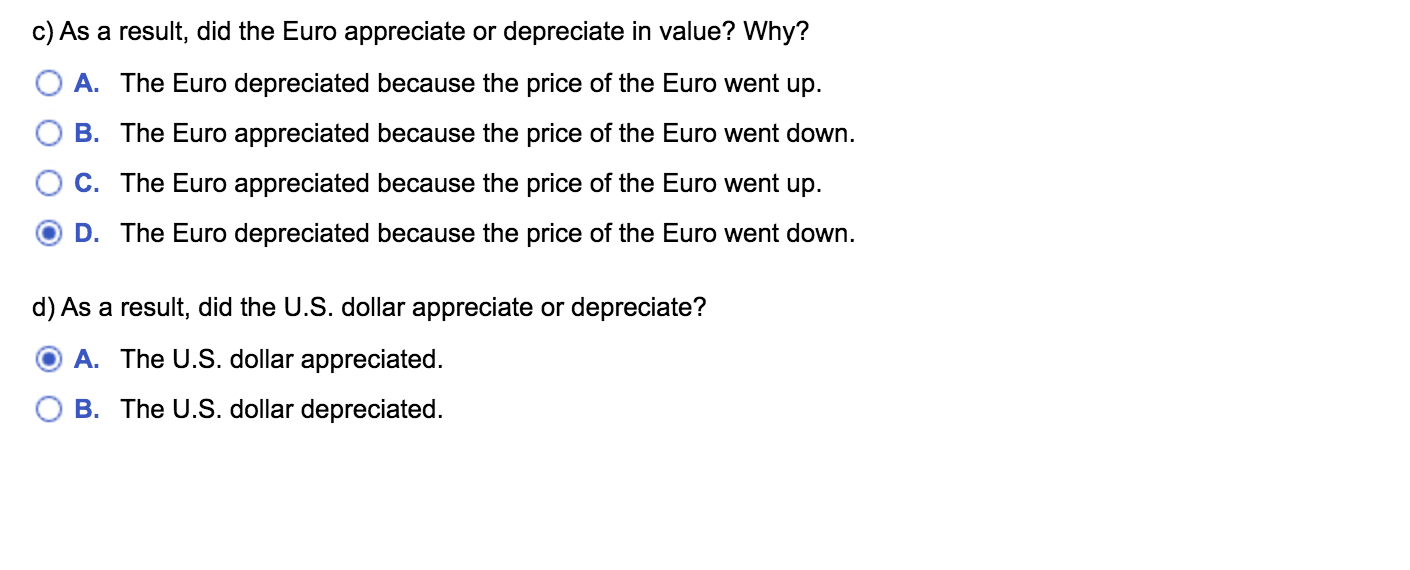
Production Tons of Grain Cars Point A 0 30 B 2 28 C 4 24 D 6 18 m 8 10 F 10 0 The table above lists 6 points on the production possibilities frontier for grain and cars. a) If the economy would like to produce b) If the economy would like to produce c) If the economy would like to produce 2 tons of grain and 25 cars, this point is: 6 tons of grain and 20 cars, this point is: 8 tons of grain and 10 cars, this point is: O A. Only Unattainable O A. Attainable and efficient O A. Only attainable O B. Only Inefficient O B. Attainable and inefficient O B. Attainable and efficient O C. Only attainable O C. Only Inefficient O C. Only Inefficient O D. Only efficient O D. Only attainable O D. Unattainable and inefficient O E. Attainable and efficient O E. Unattainable and efficient O E. Only Unattainable OF. Unattainable and efficient O F. Unattainable and inefficient O F. Only efficient O G. Attainable and inefficient O G. Only Unattainable O G. Unattainable and efficient O H. Unattainable and inefficient O H. Only efficient O H. Attainable and inefficientd) Calculate the economy's opportunity cost of producing cars when it moves from Production Point D to Production Point C. The 00 is equal to Numerical value: Units 0 A. 32 O A. $ O B. 6 O B. cars 0 c. 3 O C. No units are required 0 D. 10 O D. tons of grain O E. 2 O F. 42 O G. 0.33 The graph to the right shows the market for Euros. The Market for Euros Q ' a) What is the correct labs] for the x-axis? A. Quantity of Euros. O B. Quantity of Dollars. O C. Dollars per Euro. 0 D. Euros per Dollar. b) What is the correct label for the yaxis? O A. Quantity of Euros. (D B. Dollars per Euro. 0 c. Quantity of Dollars. O D. Euros per Dollar. 0) Suppose that the interest rate in the US. increases relative to the interest rate in Europe. Illustrate the effect(s) of this 0 160 260 300 460 500 660 on the graph. Use the straight line drawing tool to draw the shift(s). Properly label any lines that you draw, and draw a point at the new equilibrium. c) As a result, did the Euro appreciate or depreciate in value? Why? 0 A. The Euro depreciated because the price of the Euro went up. 0 B. The Euro appreciated because the price of the Euro went down. 0 C. The Euro appreciated because the price of the Euro went up. G) D. The Euro depreciated because the price of the Euro went down. d) As a result, did the U.S. dollar appreciate or depreciate? G) A. The US. dollar appreciated. 0 B. The U.S. dollar depreciated
Step by Step Solution
There are 3 Steps involved in it

Get step-by-step solutions from verified subject matter experts