

Question: Hello, If you could please check my work on the following Excel assignment, that would be greatly appreciated. Thank you in advance! As a side
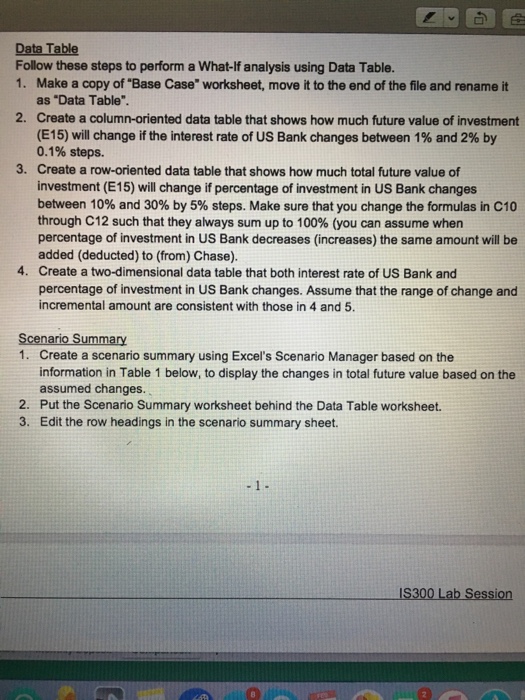
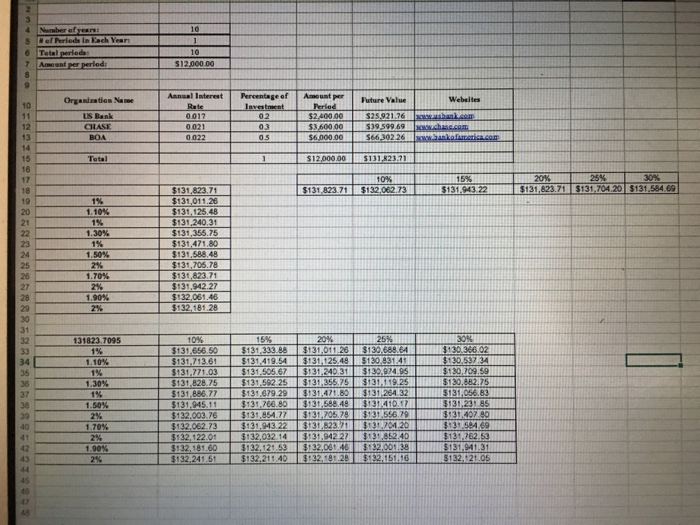
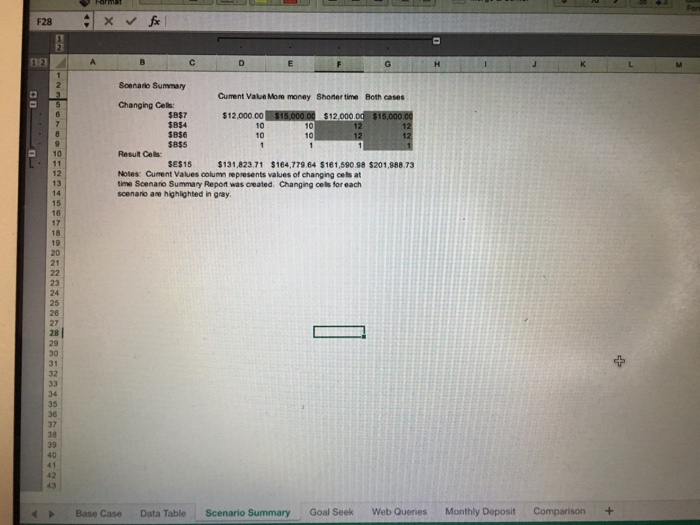
Data Table Follow these steps to perform a What-lf analysis using Data Table. 1. Make a copy of "Base Case" worksheet, move it to the end of the file and rename it as "Data Table". 2. Create a column-oriented data table that shows how much future value of investment (E15) will change if the interest rate of US Bank changes between 1% and 2% by 0.1% steps. 3. Create a row-oriented data table that shows how much total future value of investment (E15) will change ifpercentage of investment in US Bank changes between 10% and 30% by 5% steps. Make sure that you change the formulas in C10 through C12 such that they always sum up to 100% (you can assume when percentage of investment in US Bank decreases (increases) the same amount will be added (deducted) to (from) Chase). 4. Create a two-dimensional data table that both interest rate of US Bank and percentage of investment in US Bank changes. Assume that the range of change and incremental amount are consistent with those in 4 and 5. Scenario Summary 1. Create a scenario summary using Excel's Scenario Manager based on the information in Table 1 below, to display the changes in total future value based on the assumed changes. 2. Put the Scenario Summary worksheet behind the Data Table worksheet. 3. Edit the row headings in the scenario summary sheet. IS300 Lab Session Data Table Follow these steps to perform a What-lf analysis using Data Table. 1. Make a copy of "Base Case" worksheet, move it to the end of the file and rename it as "Data Table". 2. Create a column-oriented data table that shows how much future value of investment (E15) will change if the interest rate of US Bank changes between 1% and 2% by 0.1% steps. 3. Create a row-oriented data table that shows how much total future value of investment (E15) will change ifpercentage of investment in US Bank changes between 10% and 30% by 5% steps. Make sure that you change the formulas in C10 through C12 such that they always sum up to 100% (you can assume when percentage of investment in US Bank decreases (increases) the same amount will be added (deducted) to (from) Chase). 4. Create a two-dimensional data table that both interest rate of US Bank and percentage of investment in US Bank changes. Assume that the range of change and incremental amount are consistent with those in 4 and 5. Scenario Summary 1. Create a scenario summary using Excel's Scenario Manager based on the information in Table 1 below, to display the changes in total future value based on the assumed changes. 2. Put the Scenario Summary worksheet behind the Data Table worksheet. 3. Edit the row headings in the scenario summary sheet. IS300 Lab Session
Step by Step Solution
There are 3 Steps involved in it

Get step-by-step solutions from verified subject matter experts