

Question: Hello I'm doing an experiment on 4 different teas and how they affect sleep. can you please compare each of these teas in SOCS analysis
Hello I'm doing an experiment on 4 different teas and how they affect sleep.
can you please compare each of these teas in SOCS analysis using the graph. please discuss them in terms of SOCS, not just reporting these features of each distribution in isolation. remember to compare each of the four tea's Shape: you should state whether each distribution is skewed left, right or roughly symmetric.
Outliers: Mathematically check for any outliers in both data sets using the 1.5 x IQR Rule.
Center: If you stated the shape is skewed left or right or if the data contains outliers, you should state what that the median is the appropriate measure of center. You should also state the value of the median (when possible). If you stated the shape is symmetric, you should state what that the mean is the appropriate measure of center. You should also state the value of the mean (when possible).
Spread: No matter the shape, you should always give the range of the data set. In addition you should also state either the interquartile range when the shape is skewed or standard deviation when the shape is symmetric.
Graph:
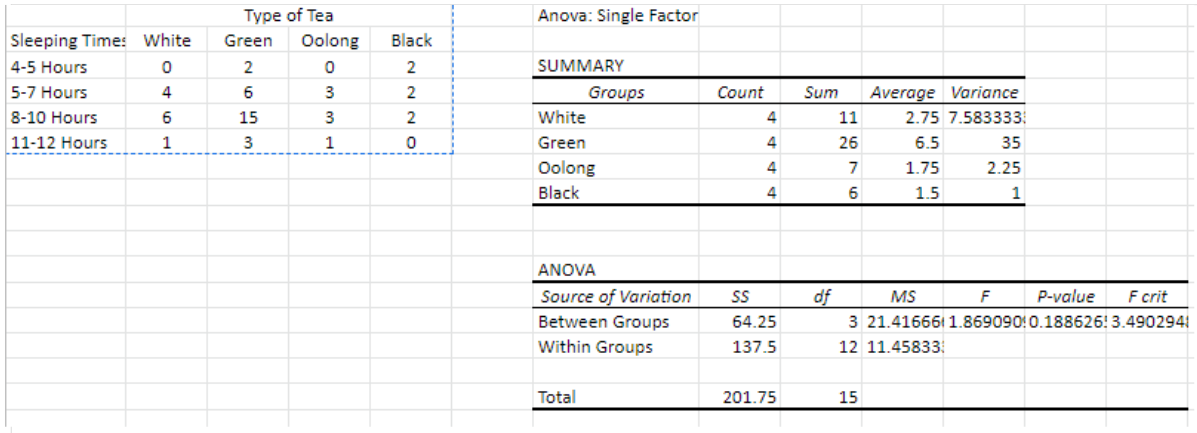
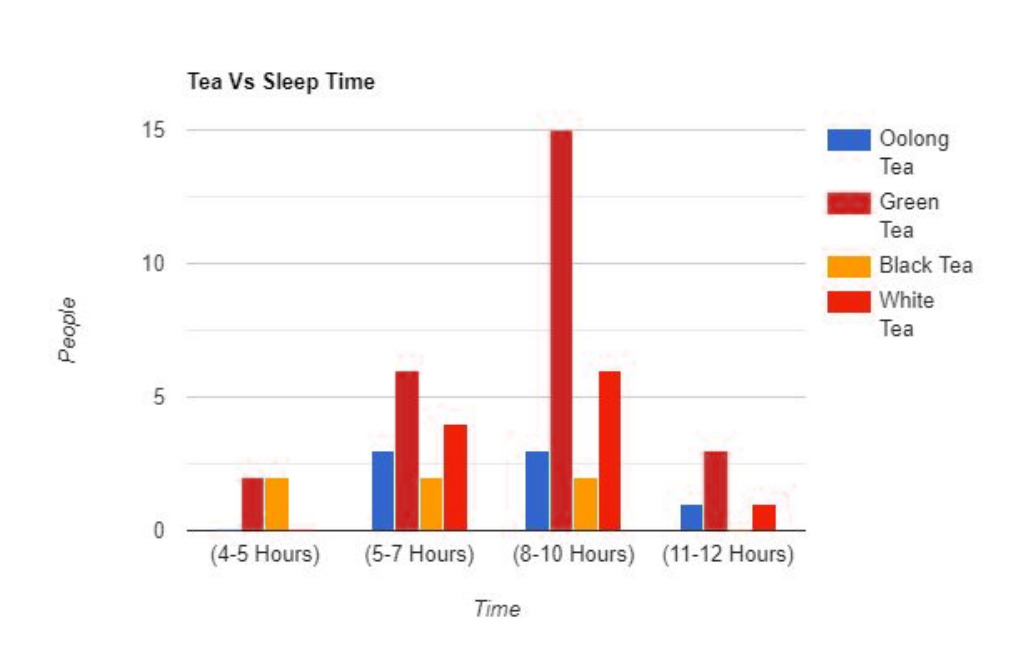
Type of Tea Anova: Single Factor Sleeping Times White Green Oolong Black 4-5 Hours 0 2 0 SUMMARY 5-7 Hours 4 6 Groups Count Sum Average Variance ONNN 8-10 Hours 6 15 White 4 11 2.75 7.583333 11-12 Hours 1 3 Green 4 26 6.5 35 Oolong 4 7 1.75 2.25 Black 4 6 1.5 1 ANOVA Source of Variation SS of MS F P-value F crit Between Groups 64.25 3 21.41666 1.869090 0.188626! 3.4902941 Within Groups 137.5 12 11.45833 Total 201.75 15Tea Vs Sleep Time 15 Oolong Tea Green Tea 10 Black Tea White Tea People 0 (4-5 Hours) (5-7 Hours) (8-10 Hours) (11-12 Hours) Time
Step by Step Solution
There are 3 Steps involved in it

Get step-by-step solutions from verified subject matter experts