

Question: Hello, I'm having problems understanding how to solve this problem. I've solved problems like this before but I'm having problems figuring out where to start.
Hello, I'm having problems understanding how to solve this problem. I've solved problems like this before but I'm having problems figuring out where to start. can someone explain how to solve this??
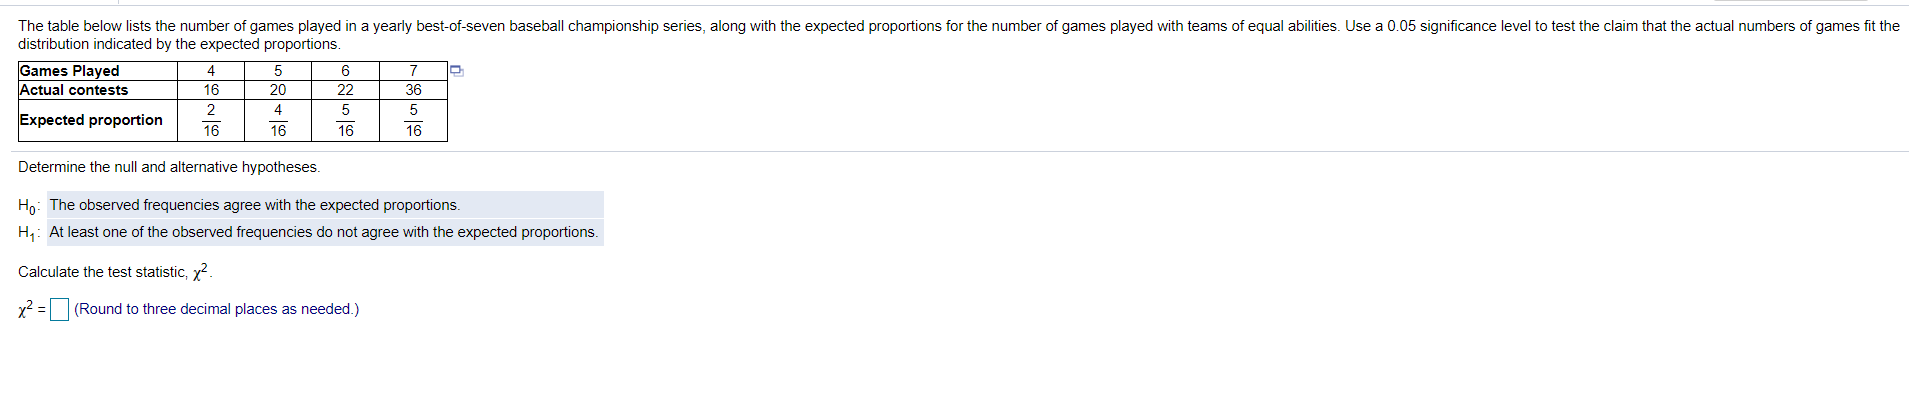
The table below lists the number of games played in a yearly best-of-seven baseball championship series, along with the expected proportions for the number of games played with teams of equal abilities. Use a 0.05 significance level to test the claim that the actual numbers of games fit the distribution indicated by the expected proportions. Games Played 4 5 6 Actual contests 16 20 22 36 2 5 5 Expected proportion 16 16 16 16 Determine the null and alternative hypotheses. Ho: The observed frequencies agree with the expected proportions. H1: At least one of the observed frequencies do not agree with the expected proportions. Calculate the test statistic, x2 x2 = (Round to three decimal places as needed.)
Step by Step Solution
There are 3 Steps involved in it

Get step-by-step solutions from verified subject matter experts