

Question: Hello, I'm working on a problem set that I am trying to generate a forest plot using data from an assignment. (see the link below
Hello,
I'm working on a problem set that I am trying to generate a forest plot using data from an assignment. (see the link below for the data) - I am struggling with how to create the forest plot using the data. Could use your help and guidance how to generate this chart on my own similar to the example shown below.
Example:
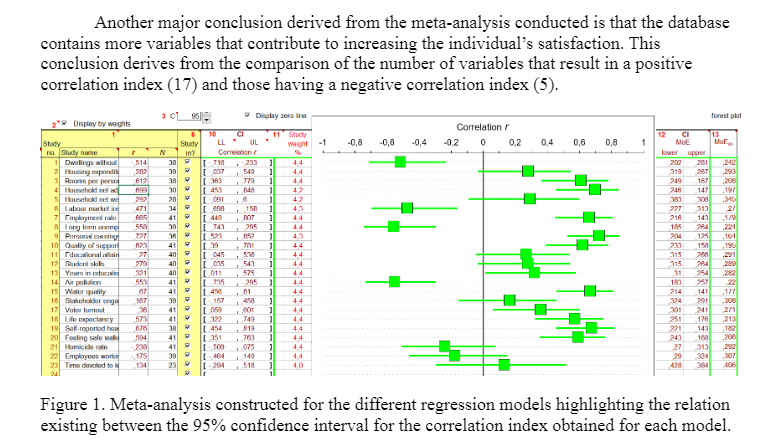
Another major conclusion derived from the meta-analysis conducted is that the database contains more variables that contribute to inereasing the individual's satisfaction. This conclusion derives from the comparison of the number of variables that result in a positive correlation index (I?) and those having a negative correlation index (5). [-15 [J'Wi [#5 m I.\" .l'l I I As! .H I I .m- m I 32'? 4-! .451: .351 . 3 I I as: F F P P I! p F P D II a F P D II F P P r p F P P p- Figure 1. Meta-analysis constructed for the different regression models highlighting the relation existing between the 95% condence interval for the correlation index obtained for each model
Step by Step Solution
There are 3 Steps involved in it

Get step-by-step solutions from verified subject matter experts