

Question: Hello please answer the following questions below. Please see attached photos for the instructions Follow the instructions given below: I. A survey was taken on
Hello please answer the following questions below. Please see attached photos for the instructions
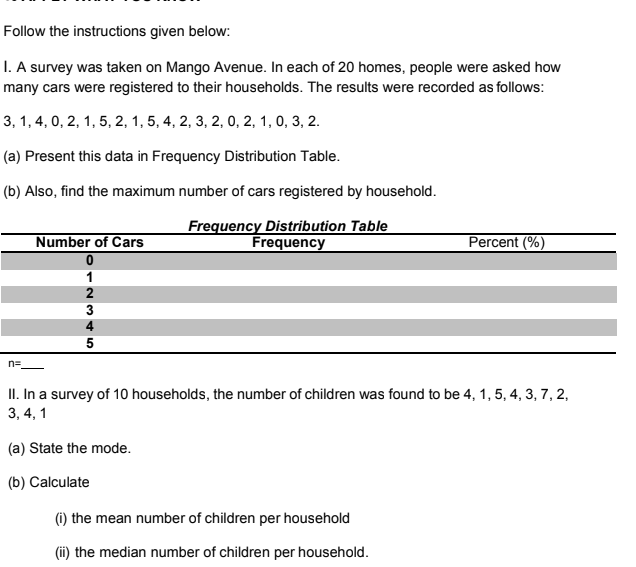
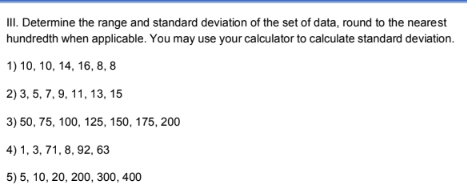
Follow the instructions given below: I. A survey was taken on Mango Avenue. In each of 20 homes, people were asked how many cars were registered to their households. The results were recorded as follows: 3, 1, 4, 0, 2, 1, 5, 2, 1, 5, 4, 2, 3, 2, 0, 2, 1, 0, 3, 2. (a) Present this data in Frequency Distribution Table. (b) Also, find the maximum number of cars registered by household. Frequency Distribution Table Number of Cars Frequency Percent (% ) JAWN-C n= Il. In a survey of 10 households, the number of children was found to be 4, 1, 5, 4, 3, 7, 2, 3, 4, 1 (a) State the mode. (b) Calculate (i) the mean number of children per household (ii) the median number of children per household.Ill. Determine the range and standard deviation of the set of data, round to the nearest hundredth when applicable. You may use your calculator to calculate standard deviation. 1) 10, 10. 14. 16, 8, 8 2) 3, 5. 7, 9, 11, 13, 15 3) 50, 75, 100, 125, 150, 175, 200 4) 1, 3, 71, 8, 92, 63 5) 5, 10, 20, 200, 300, 400
Step by Step Solution
There are 3 Steps involved in it

Get step-by-step solutions from verified subject matter experts