

Question: Hello, Please complete it using R. Thank you. Part II - Elo Ratings One of the earliest examples of a convergent, adaptive Markov process was
Hello,
Please complete it using R. Thank you.
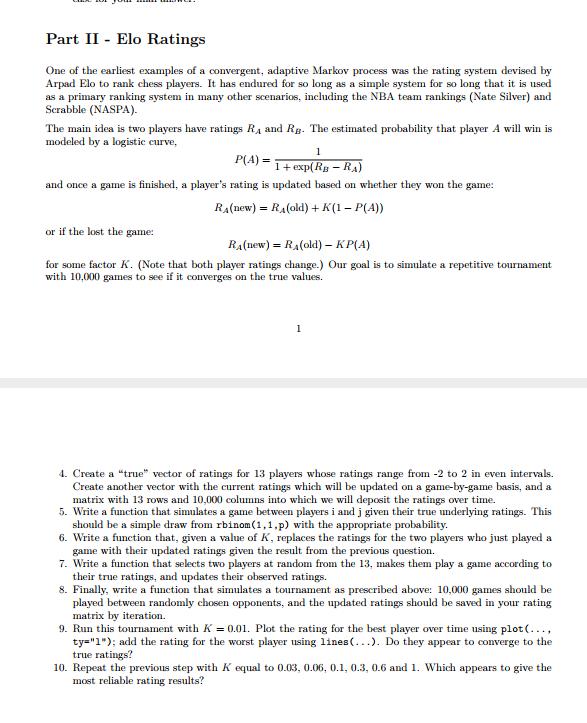
Part II - Elo Ratings One of the earliest examples of a convergent, adaptive Markov process was the rating system devised by Arpad Elo to rank chess players. It has endured for so long as a simple system for so long that it is used as a primary ranking system in many other scenarios, including the NBA team rankings (Nate Silver) and Scrabble (NASPA). The main idea is two players have ratings RA and Ry. The estimated probability that player A will win is modeled by a logistic curve, P(A) = 1 + exp(RB - RA) and once a game is finished, a player's rating is updated based on whether they won the game: RA(new) = RA(old) + K(1 - P(A)) or if the lost the game: RA(new) = RA(old) - KP(A) for some factor K. (Note that both player ratings change.) Our goal is to simulate a repetitive tournament with 10,000 games to see if it converges on the true values. 4. Create a "true" vector of ratings for 13 players whose ratings range from -2 to 2 in even intervals. Create another vector with the current ratings which will be updated on a game-by-game basis, and a matrix with 13 rows and 10,000 columns into which we will deposit the ratings over time. 5. Write a function that simulates a game between players i and j given their true underlying ratings. This should be a simple draw from rbinom(1, 1,p) with the appropriate probability. 6. Write a function that, given a value of A, replaces the ratings for the two players who just played a game with their updated ratings given the result from the previous question. 7. Write a function that selects two players at random from the 13, makes them play a game according to their true ratings, and updates their observed ratings. 8. Finally, write a function that simulates a tournament as prescribed above: 10,000 games should be played between randomly chosen opponents, and the updated ratings should be saved in your rating matrix by iteration. 9. Run this tournament with A = 0.01. Plot the rating for the best player over time using plot (. .., ty="1"); add the rating for the worst player using lines(...). Do they appear to converge to the true ratings? 10. Repeat the previous step with A equal to 0.03, 0.06, 0.1, 0.3, 0.6 and 1. Which appears to give the most reliable rating results
Step by Step Solution
There are 3 Steps involved in it

Get step-by-step solutions from verified subject matter experts