

Question: Hello. Please explain the solutions for this question. Also, please, explain how can to construct the curves using Excel. Thank you very much! 13. Suppose
Hello. Please explain the solutions for this question. Also, please, explain how can to construct the curves using Excel. Thank you very much!
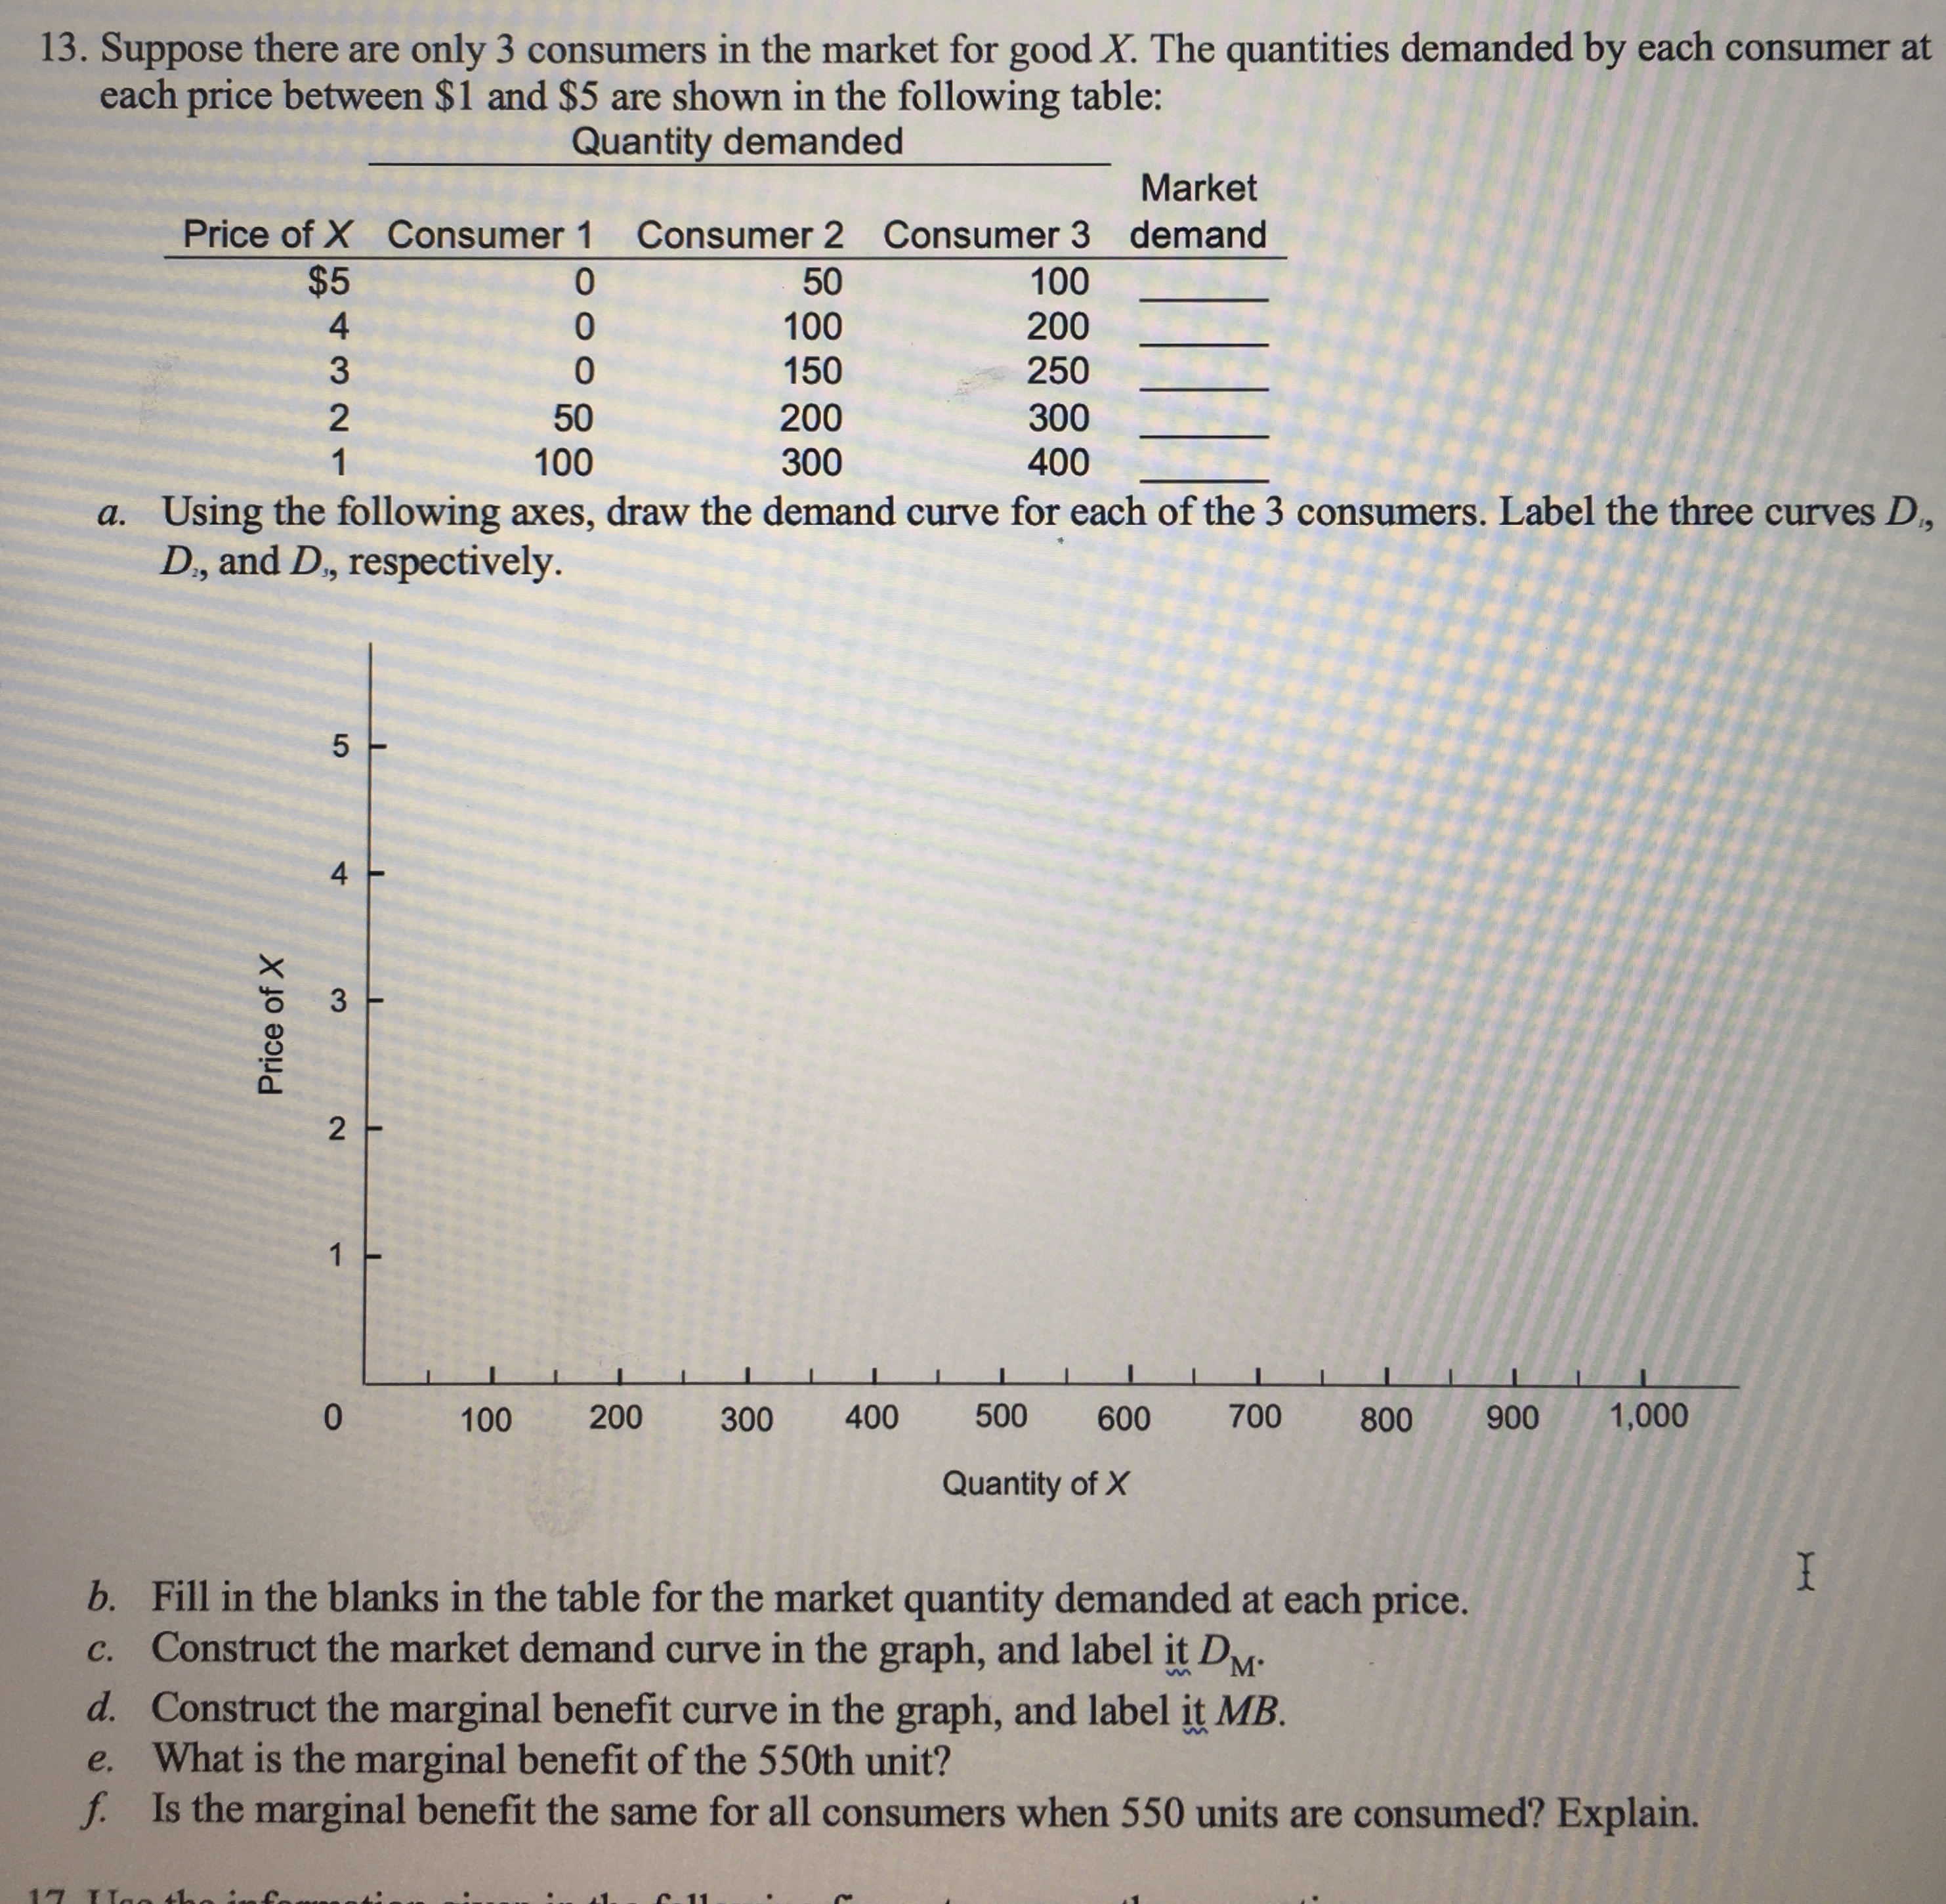
13. Suppose there are only 3 consumers in the market for good X. The quantities demanded by each consumer at each price between $1 and $5 are shown in the following table: Quantity demanded Market Price of X Consumer 1 Consumer 2 Consumer 3 demand $5 O 50 100 N C. 100 200 150 250 50 200 300 100 300 400 a. Using the following axes, draw the demand curve for each of the 3 consumers. Label the three curves D, D., and D,, respectively. 4 Price of X 3 2 1 0 100 200 300 400 500 600 700 800 900 1,000 Quantity of X b. Fill in the blanks in the table for the market quantity demanded at each price. c. Construct the market demand curve in the graph, and label it DM- d. Construct the marginal benefit curve in the graph, and label it MB. e. What is the marginal benefit of the 550th unit? f. Is the marginal benefit the same for all consumers when 550 units are consumed? Explain
Step by Step Solution
There are 3 Steps involved in it

Get step-by-step solutions from verified subject matter experts