

Question: Hello: Please give a hand with this problem I need to confirm my answers. My answers are bold and also please check the graph did
Hello:
Please give a hand with this problem I need to confirm my answers. My answers are bold and also please check the graph did I plot the points correctly?
Thanks
Money supply, money demand, and adjustment to monetary equilibrium
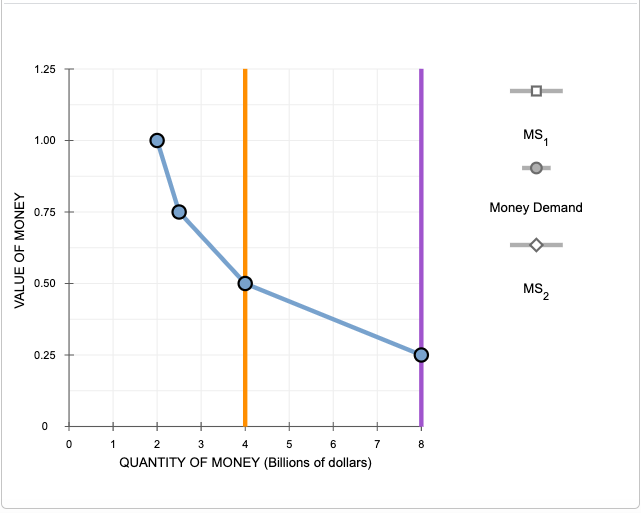
The following table shows a money demand schedule, which is the quantity of money demanded at various price levels (P).
Fill in the Value of Money column in the following table.
My answers are under value of money tab the other two tabs are given
Price Level (P). Value of Money (1/P) Quantity of Money Demanded (Billions of dollars)
1.00 1.00 2.0
1.33 0.75 2.5
2.00 0.50 4.0
4.00 0.25 8.0
Now consider the relationship between the price level and the quantity of money that people demand. The lower the price level, the lessmoney the typical transaction requires, and the lessmoney people will wish to hold in the form of currency or demand deposits.
Assume that the Fed initially fixes the quantity of money supplied at $4 billion.
Use the orange line (square symbol) to plot the initial money supply (MS1) set by the Fed. Then, referring to the previous table, use the blue connected points (circle symbol) to graph the money demand curve.
1.25 O 1.00 O MS VALUE OF MONEY 0.75 Money Demand 0.50 MS, 0.25 0 0 1 2 3 4 5 6 7 8 QUANTITY OF MONEY (Billions of dollars)
Step by Step Solution
There are 3 Steps involved in it

Get step-by-step solutions from verified subject matter experts