

Question: Hello, please help me with this, I continue to get it incorrect. I . Explaining short-run economic fluctuations Most economists believe that real economic variables
Hello, please help me with this, I continue to get it incorrect.

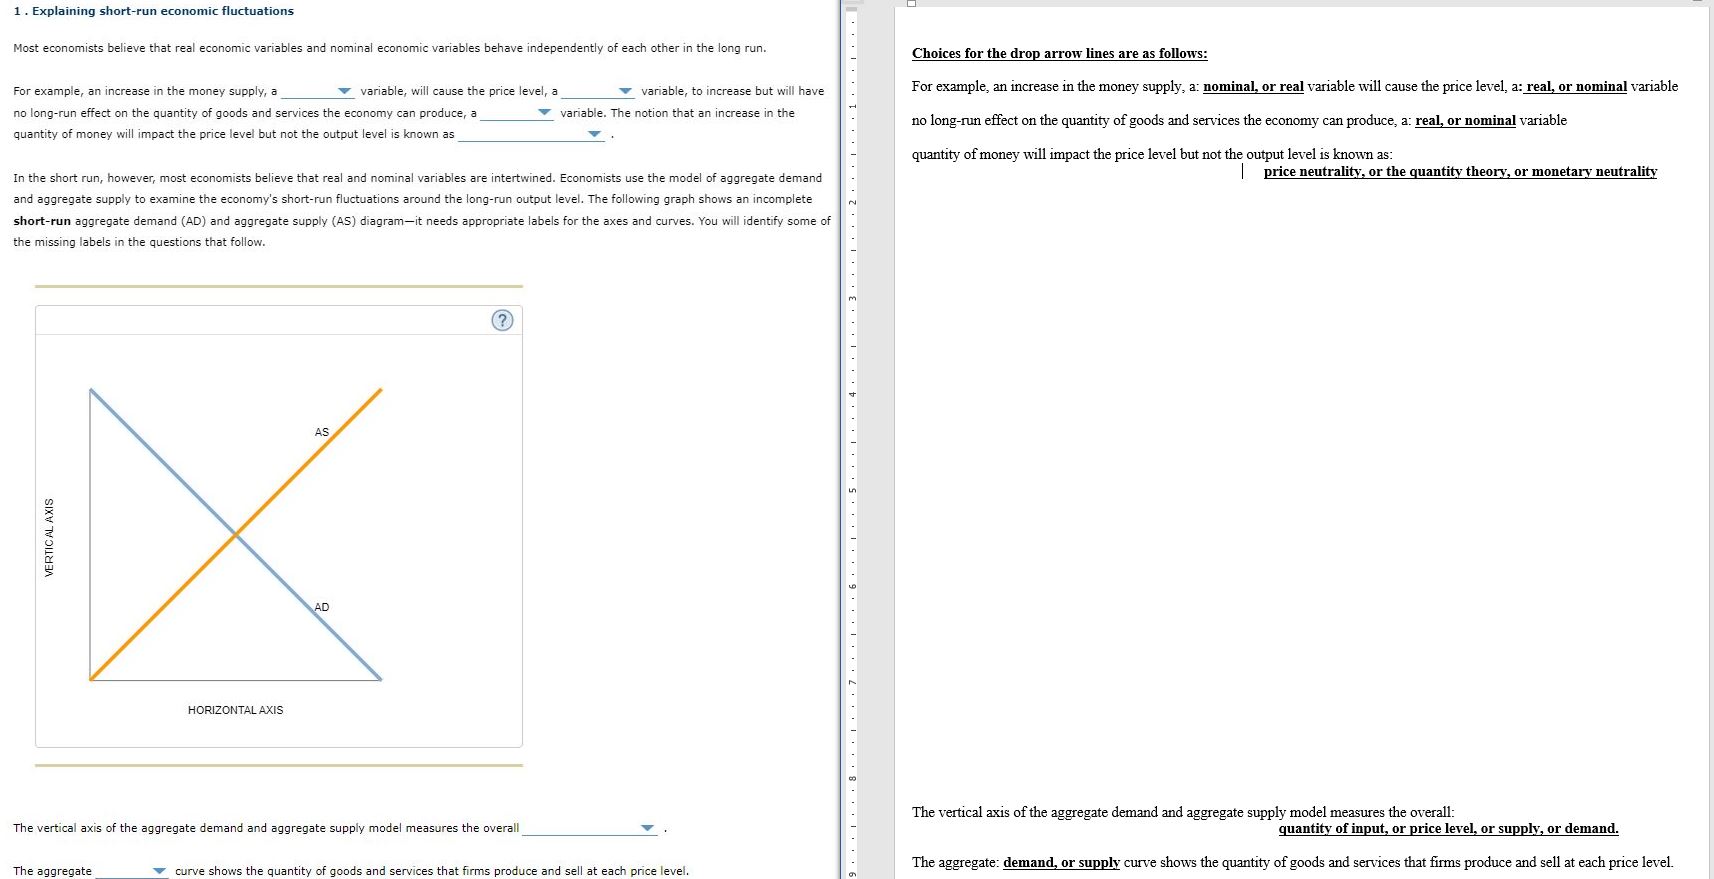
I . Explaining short-run economic fluctuations Most economists believe that real economic variables and nominal economic variables behave independently of each other in the long run. For example, an increase in the money supply, a v variable, will cause the price level, a variable, to increase but will have no long-run effect on the quantity of goods and services the economy can produce, a quantity of money will impact the price level but not the output level is knuvn as e variable. The notion that an lncrease in the In the short run, however, most economists believe that real and nominal variables are intertwined. Economists use the model of aggregate demand and aggregate supply to examine the economy's short-run fluctuations around the long-run output level. The following graph shows an incomplete short-run aggregate demand (AD) and aggregate supply (AS) diagramit needs appropriate labels for the axes and curves. You will identify some of the missing labels in the questions that follow. HORIZONTAL AXIS The vertical axis of the aggregate demand and aggregate supply model measures the overall Choices for the drop arrow lines are as follows: For example, an increase in the money supply, a: nominal, or real variable will cause the price level, a: real. or nominal variable no long-run effect on the quantity of goods and services the economy can produce, a: real. or nominal variable quantity of money will impact the price level but not the output level is knoum as: or mon The vertical axis of the aggregate demand and aggregate supply model measures the overall: The aggregate: quantity of input, or price level, or supply. or demand. curve shows the quantity of goods and services that firms produce and sell at each price level. The aggregate curve shows the quantity of goods and services that firms produce and sell at each price level.
Step by Step Solution
There are 3 Steps involved in it

Get step-by-step solutions from verified subject matter experts