

Question: Hello, Please help me with this practice test for my upcoming algebra II test on Statistics. Question 1 Which of the following can be used
Hello, Please help me with this practice test for my upcoming algebra II test on Statistics.
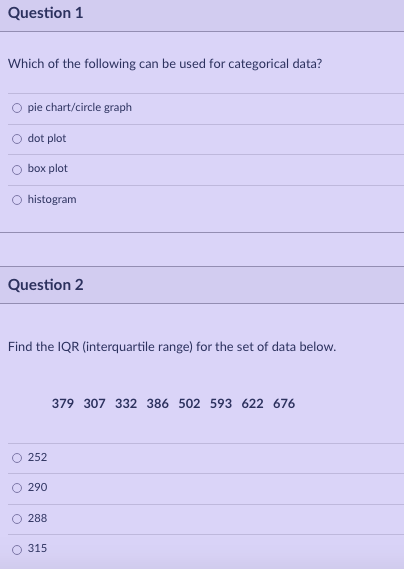
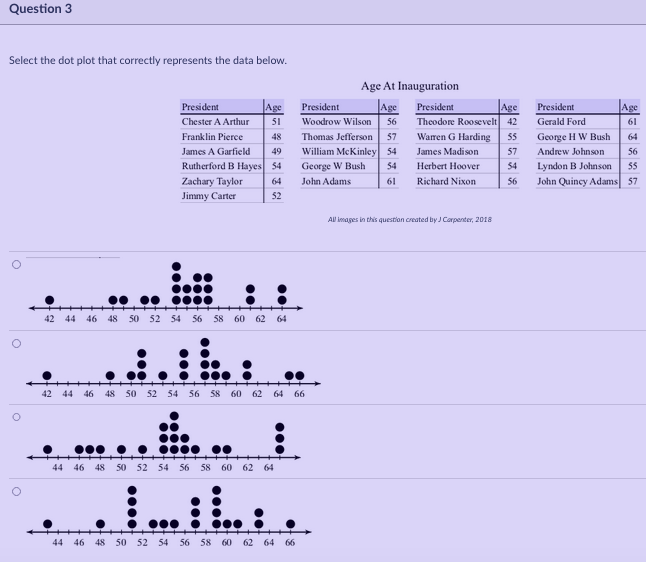
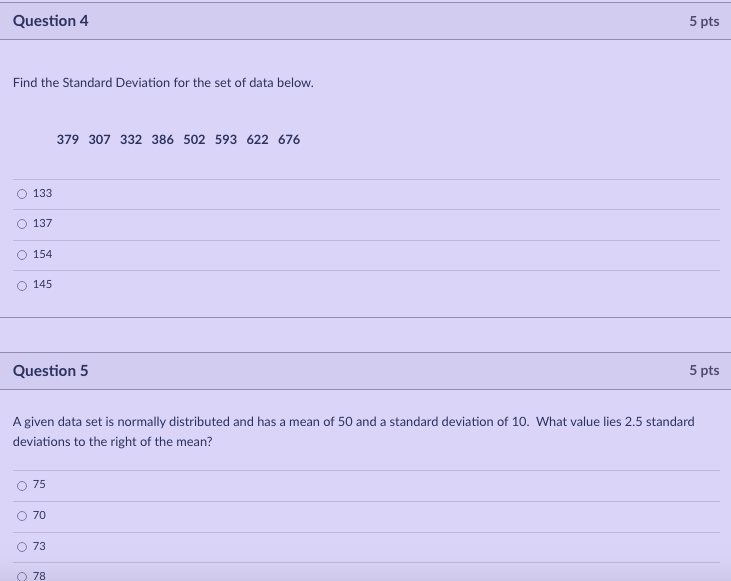
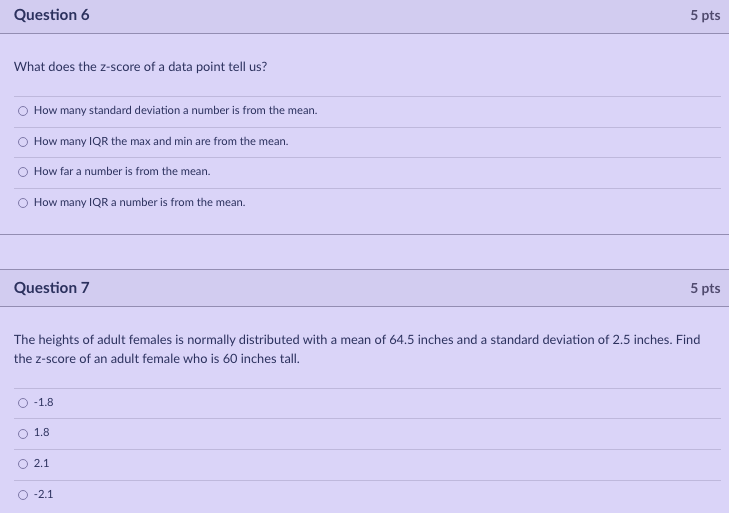
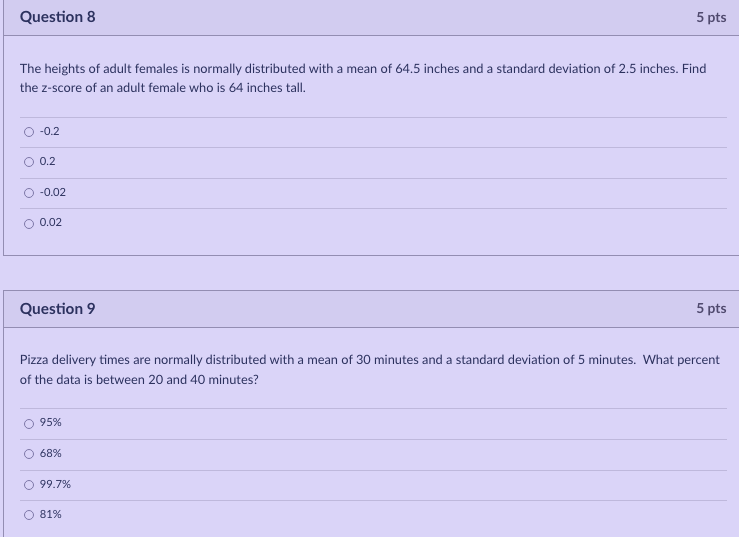
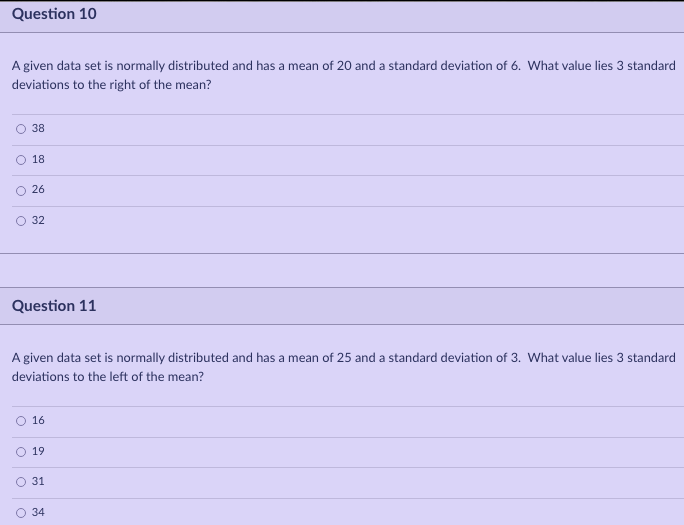
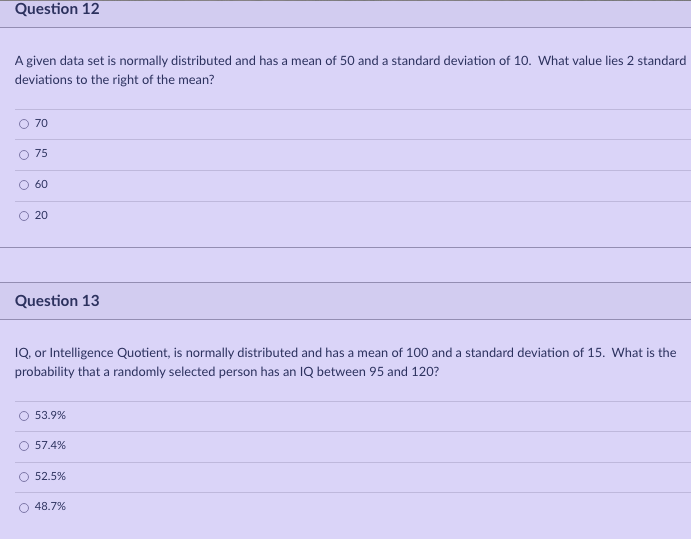
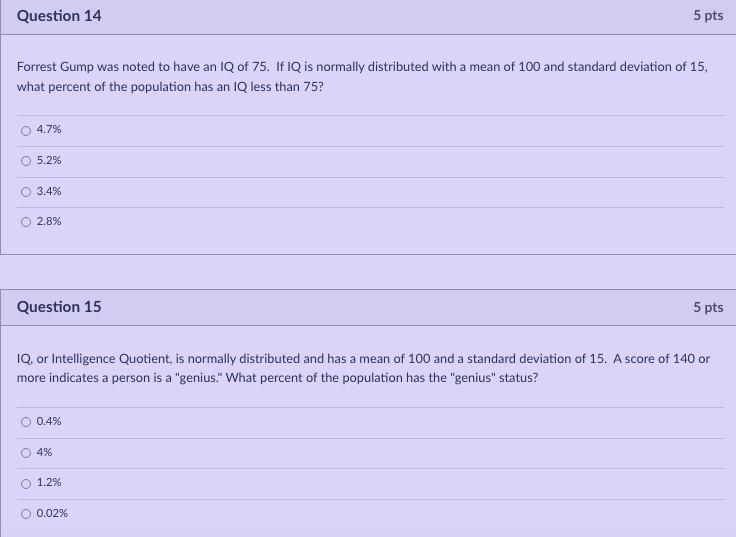
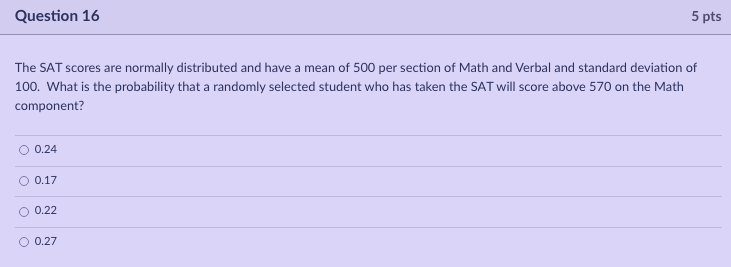
Question 1 Which of the following can be used for categorical data? O pie chart/circle graph O dot plot O box plot O histogram Question 2 Find the IQR (interquartile range) for the set of data below. 379 307 332 386 502 593 622 676 O 252 O 290 O 288 O 315Question 3 Select the dot plot that correctly represents the data below. Age At Inauguration President Age President Age President Age President Age Chester A Arthur 51 Woodrow Wilson 56 Theodore Roosevelt 42 Gerald Ford 61 Franklin Pierce 18 Thomas Jefferson 57 Warren G Harding George H W Bush 64 James A Garfield 49 William Mckinley 54 James Madison 57 Andrew Johnson 56 Rutherford B Hayes 54 George W Bush 54 Herbert Hoover 54 Lyndon B Johnson Zachary Taylor 64 John Adams Richard Nixon 56 John Quincy Adams 57 Jimmy Carter 52 All images in this question created by J Carpenter, 2018 O 42 44 46 48 50 52 54 56 58 60 62 64 42 44 46 48 50 52 54 56 58 60 62 64 66 ... 44 46 48 50 52 54 56 58 60 62 64 44 46 48 50 52 54 56 58 60 62 64 66Question 4 5 pts Find the Standard Deviation for the set of data below. 379 307 332 386 502 593 622 676 133 O 137 O 154 O 145 Question 5 5 pts A given data set is normally distributed and has a mean of 50 and a standard deviation of 10. What value lies 2.5 standard deviations to the right of the mean? 0 75 O 70 0 73 78Question 6 5 pts What does the z-score of a data point tell us? O How many standard deviation a number is from the mean. O How many IQR the max and min are from the mean. O How far a number is from the mean. O How many IQR a number is from the mean. Question 7 5 pts The heights of adult females is normally distributed with a mean of 64.5 inches and a standard deviation of 2.5 inches. Find the z-score of an adult female who is 60 inches tall. O -1.8 1.8 O 2.1 O -2.1Question 8 5 pts The heights of adult females is normally distributed with a mean of 64.5 inches and a standard deviation of 2.5 inches. Find the z-score of an adult female who is 64 inches tall. O -0.2 O 0.2 O -0.02 O 0.02 Question 9 5 pts Pizza delivery times are normally distributed with a mean of 30 minutes and a standard deviation of 5 minutes. What percent of the data is between 20 and 40 minutes? 0 95% 0 68% O 99.7% 81%Question 10 A given data set is normally distributed and has a mean of 20 and a standard deviation of 6. What value lies 3 standard deviations to the right of the mean? O 38 O 18 O 26 O 32 Question 11 A given data set is normally distributed and has a mean of 25 and a standard deviation of 3. What value lies 3 standard deviations to the left of the mean? O 16 19 O 31 O 34Question 12 A given data set is normally distributed and has a mean of 50 and a standard deviation of 10. What value lies 2 standard deviations to the right of the mean? O 70 O 75 O 60 O 20 Question 13 1Q, or Intelligence Quotient, is normally distributed and has a mean of 100 and a standard deviation of 15. What is the probability that a randomly selected person has an IQ between 95 and 120? 0 53.9% O 57.4% 0 52.5%% O 48.7%Question 14 5 pts Forrest Gump was noted to have an IQ of 75. If IQ is normally distributed with a mean of 100 and standard deviation of 15, what percent of the population has an IQ less than 75? 0 4.7% O 5.2% 0 3.4% O 2.8% Question 15 5 pts 1Q, or Intelligence Quotient, is normally distributed and has a mean of 100 and a standard deviation of 15. A score of 140 or more indicates a person is a "genius." What percent of the population has the "genius" status? O 0.4% 0 4% 1.2% O 0.02%Question 16 5 pts The SAT scores are normally distributed and have a mean of 500 per section of Math and Verbal and standard deviation of 100. What is the probability that a randomly selected student who has taken the SAT will score above 570 on the Math component? O 0.24 O 0.17 O 0.22 O 0.27
Step by Step Solution
There are 3 Steps involved in it

Get step-by-step solutions from verified subject matter experts