

Question: please use R data can be found in R 2, The National Institute of Diabetes and Digestive and Kidney Diseases conducted a study on 1'68
please use R
data can be found in R
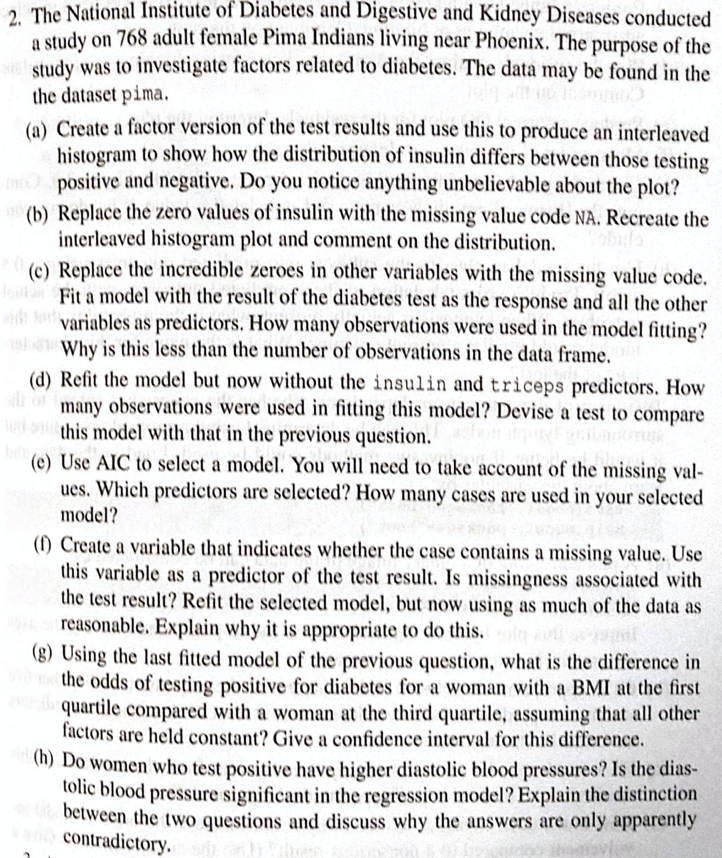
2, The National Institute of Diabetes and Digestive and Kidney Diseases conducted a study on 1'68 adult female Pima Indians living near Phoenix. The purpose of the study was to investigate factors related to diabetes. The data may he found in the the dataset plane. (it) Create a factor version of the test results and use this to produce an interleaved histogram to show how the distribution of insulin differs between those testing positive and negative. Do you notice anything unbelievable about the plot? (b) Replace the zero values of'insuiin with the missing value code NA. Recreate the interleaved histogram plot and comment on the distributiou. (0) Replace the incredible zeroes in other variables with the missing value code. Fit a model with the result of the diabetes test as the response and all the other variables as predictors. How many observations were used in the model tting? Why is this less than the number of observations in the data frame. (d) Ret the model but now without the insulin and triceps predictors. How many observations were used in tting this model? Dcvise a test to compare this model with that in the previous question. is) Use AIC to select a model. You will need to take account of the missing val- ues. Which predictors are selected? How many cases are used in your selected model? (D Create a variable that indicates whether the case contains a missing value. Use this variable as a predictor of the test result. Is missingness associated with the test result? Ret the selected model, but now using as much of the data as reasonable. Explain why it is appropriate to do this. is) Using the last tted model of the previous question. what is the difference in the odds of testing positive for diabetes for a woman with a BM! smite-rst- ' quartile compared with a woman at the third quartile. assuming that all other 4? factors are held constant? Give a condence interval for this difference {In D? Wen who test positive have higher diastoilc blood pressures}. ' ml\": \"00d pressure signicant in the regression model? Explain
Step by Step Solution
There are 3 Steps involved in it

Get step-by-step solutions from verified subject matter experts