

Question: hello. please help with both questions, this is for a study guide. please also explain. if you are unable to answer both-please do not answer.
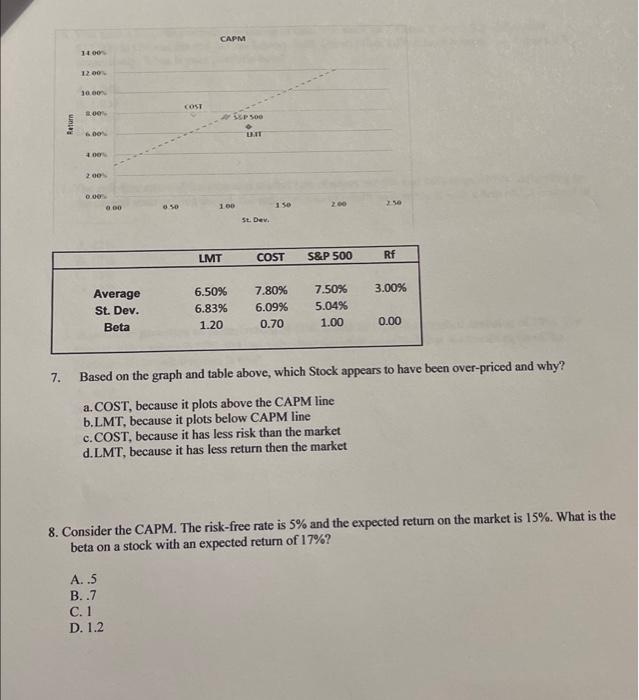
CAPM 100 12 00 1000 COST BO 3 500 eum 600 * 200 0.00 ao 50 1.00 150 200 St. Dev. LMT COST S&P 500 Rf 3.00% Average St. Dev. Beta 6.50% 6.83% 1.20 7.80% 6.09% 0.70 7.50% 5.04% 1.00 0.00 7. Based on the graph and table above, which Stock appears to have been over-priced and why? a. COST, because it plots above the CAPM line b.LMT, because it plots below CAPM line c. COST, because it has less risk than the market d.LMT, because it has less return then the market 8. Consider the CAPM. The risk-free rate is 5% and the expected return on the market is 15%. What is the beta on a stock with an expected return of 17%? A..5 B..7 C. 1 D. 1.2
Step by Step Solution
There are 3 Steps involved in it

Get step-by-step solutions from verified subject matter experts