

Question: Hello :) please show excel calculations as possible. Thank you in advance :) Consider the following locations and their fixed and variable costs. Use cross-over
Hello :) please show excel calculations as possible. Thank you in advance :)
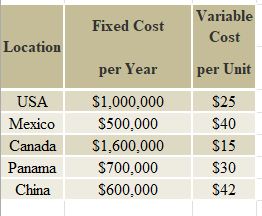
- Consider the following locations and their fixed and variable costs.
- Use cross-over analysis to find the range of production that yield minimum total production cost for each location.
- Construct linear line graph for all locations for X values from 0 to 150,000 at increment of 5000 units.
- If the units are sold at price of $100, which location yields highest profit at production volume of 110,000 units.
- For part C, construct a break-even graph (cost, revenue, profit) using X values of 0 to 150,000 at increment of 5,000 units.
\begin{tabular}{|c|c|c|} \hline Location & FixedCostperYear & VariableCostperUnit \\ \hline USA & $1,000,000 & $25 \\ \hline Mexico & $500,000 & $40 \\ \hline Canada & $1,600,000 & $15 \\ \hline Panama & $700,000 & $30 \\ \hline China & $600,000 & $42 \\ \hline \end{tabular}
Step by Step Solution
There are 3 Steps involved in it
1 Expert Approved Answer
Step: 1 Unlock

Question Has Been Solved by an Expert!
Get step-by-step solutions from verified subject matter experts
Step: 2 Unlock
Step: 3 Unlock