

Question: Hello, so I am doing frequency distribution however this questions is asking for distribution chart with a range of 5 I'm not sure is i
Hello, so I am doing frequency distribution however this questions is asking for distribution chart with a range of 5 I'm not sure is i did this correct. I would love for someone to help as far showing me how the chart should look and what the histogram for this data should look like?
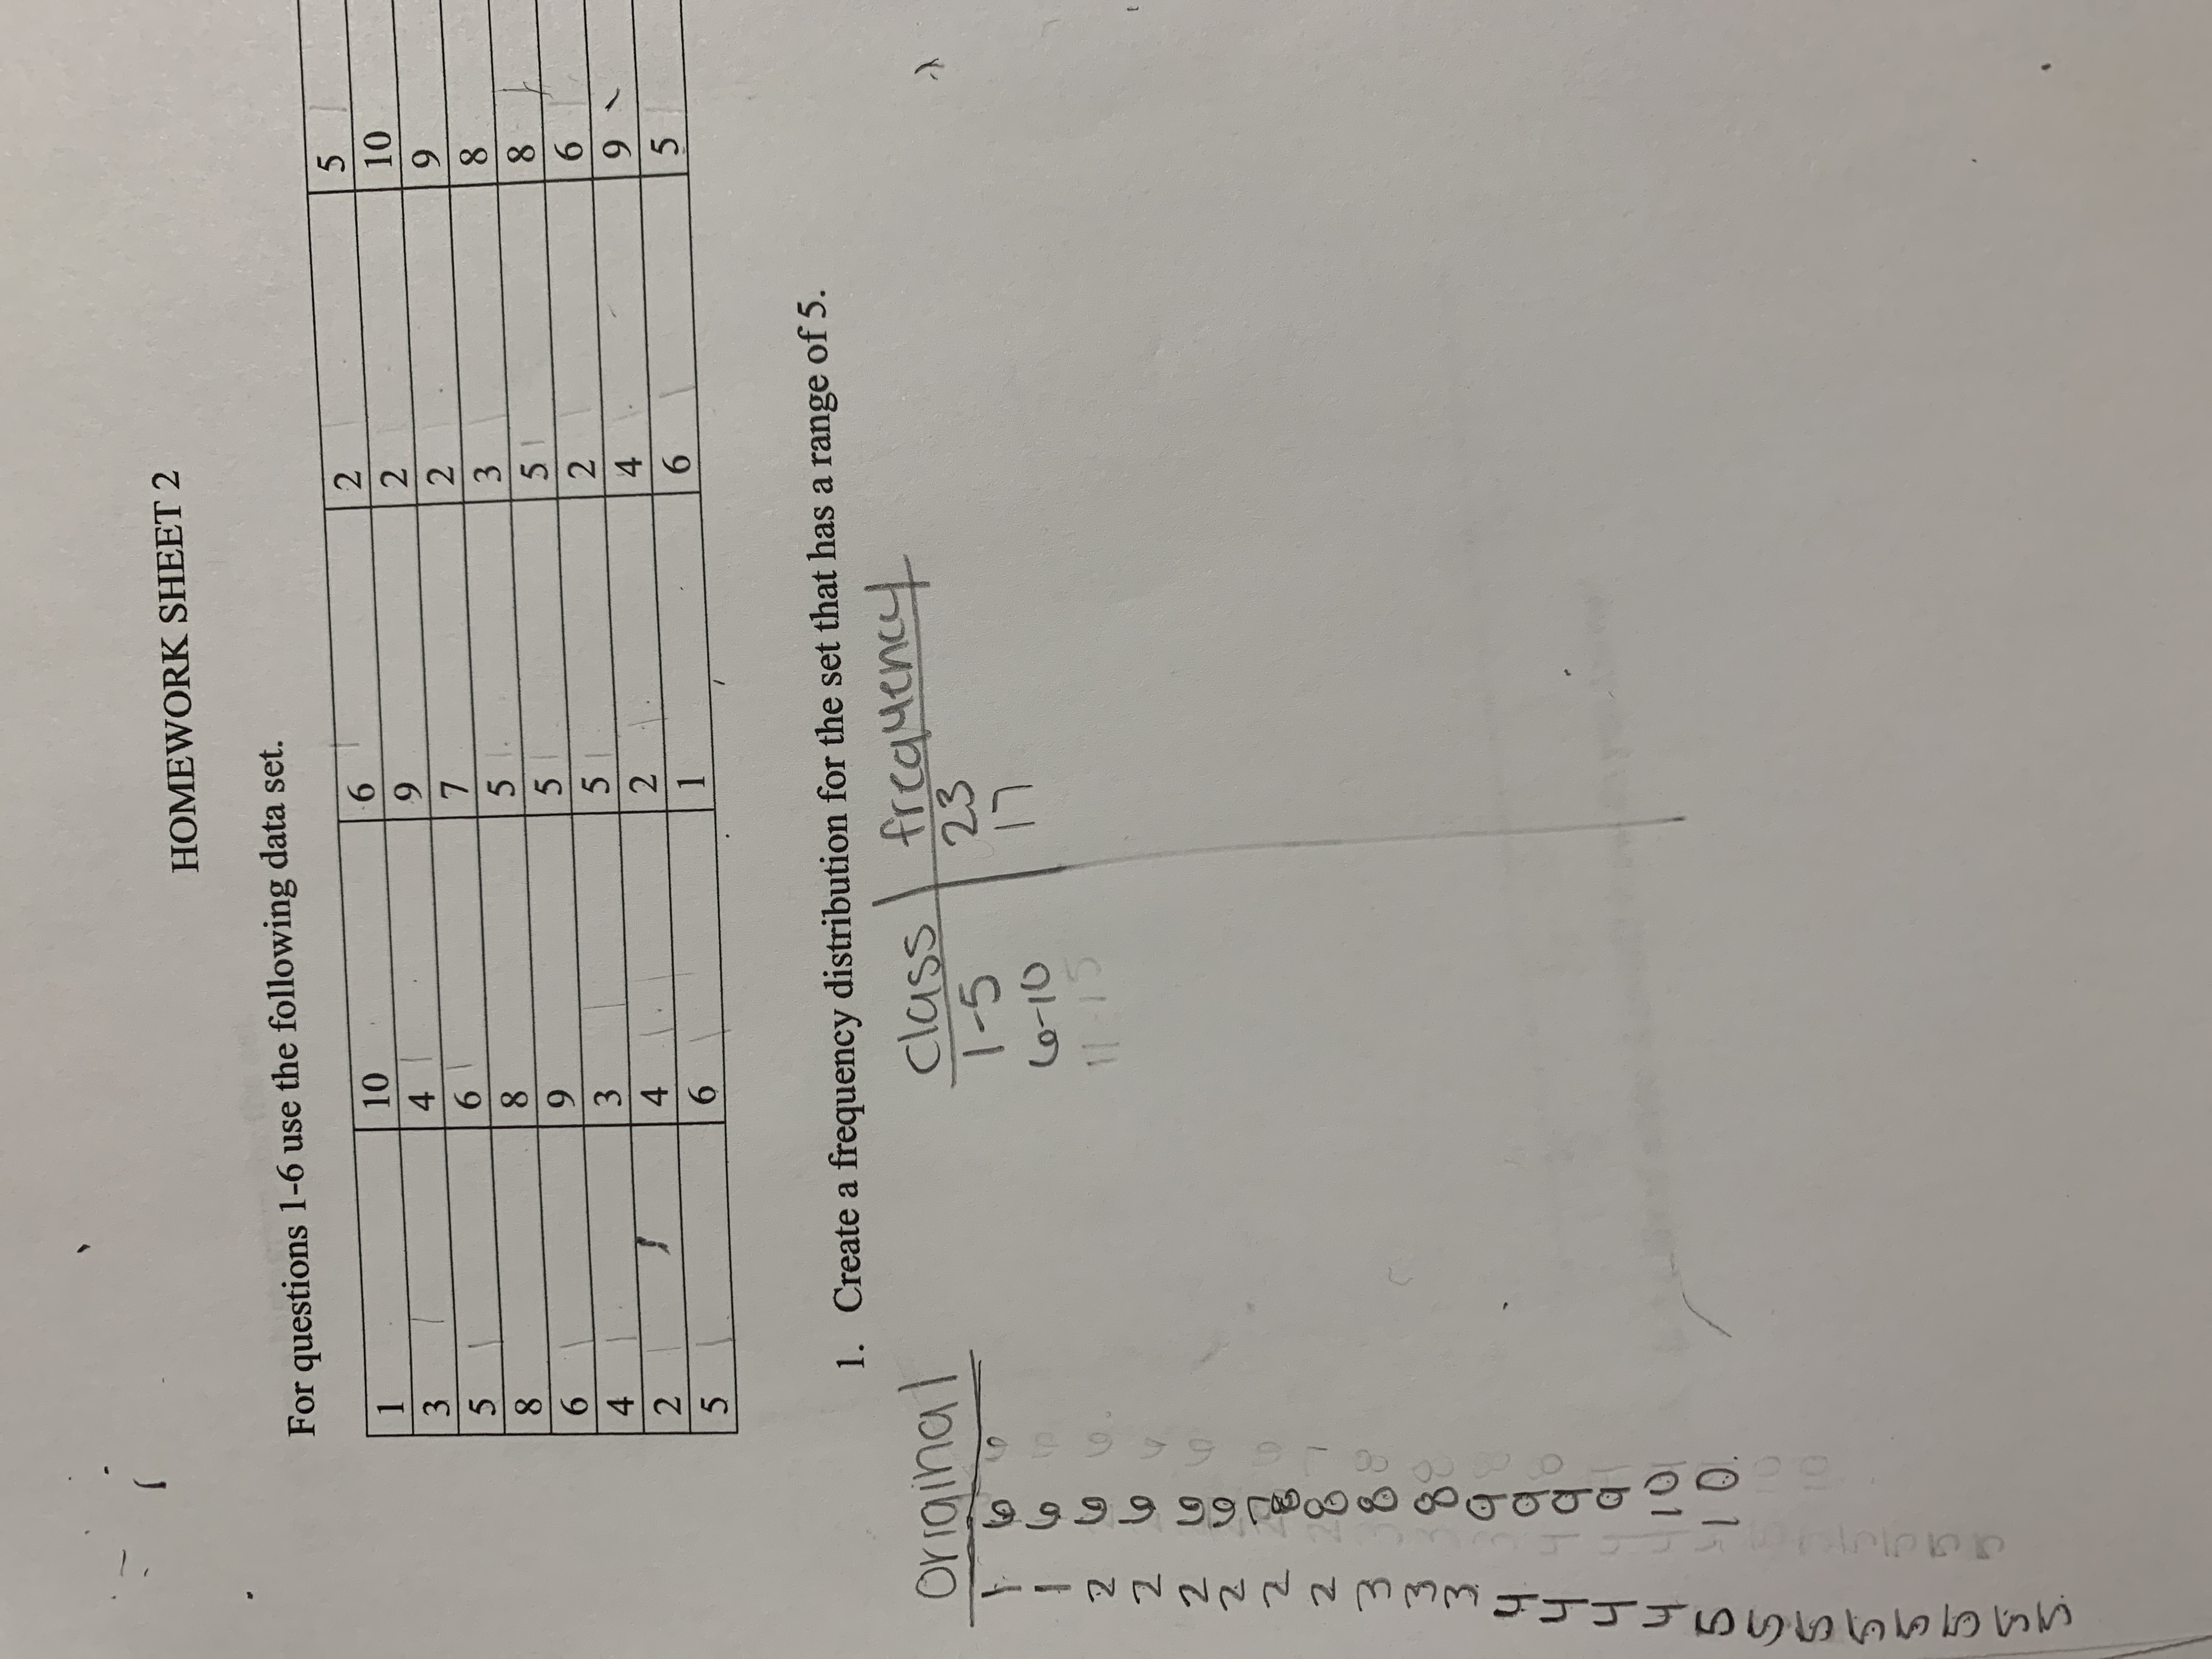
HOMEWORK SHEET 2 For questions 1-6 use the following data set. 1 10 3 6 4 2 .9 5 5 6 2 7 10 8 8 2 9 6 5 3 5 8 4 3 51 5 8 2 4 2 6 5 2 4 6 1 9 6 5 1. Create a frequency distribution for the set that has a range of 5. original class frequency 6 6565 1- 5 23 6- 10 17 11 15 CC WHENGUIDESFI WWWNNNN NN
Step by Step Solution
There are 3 Steps involved in it
1 Expert Approved Answer
Step: 1 Unlock

Question Has Been Solved by an Expert!
Get step-by-step solutions from verified subject matter experts
Step: 2 Unlock
Step: 3 Unlock