

Question: Hello, the excel is obtained from class, Cell C23= product of C16( which is the portfolio weight of US ) and sum of products of
Hello, the excel is obtained from class,
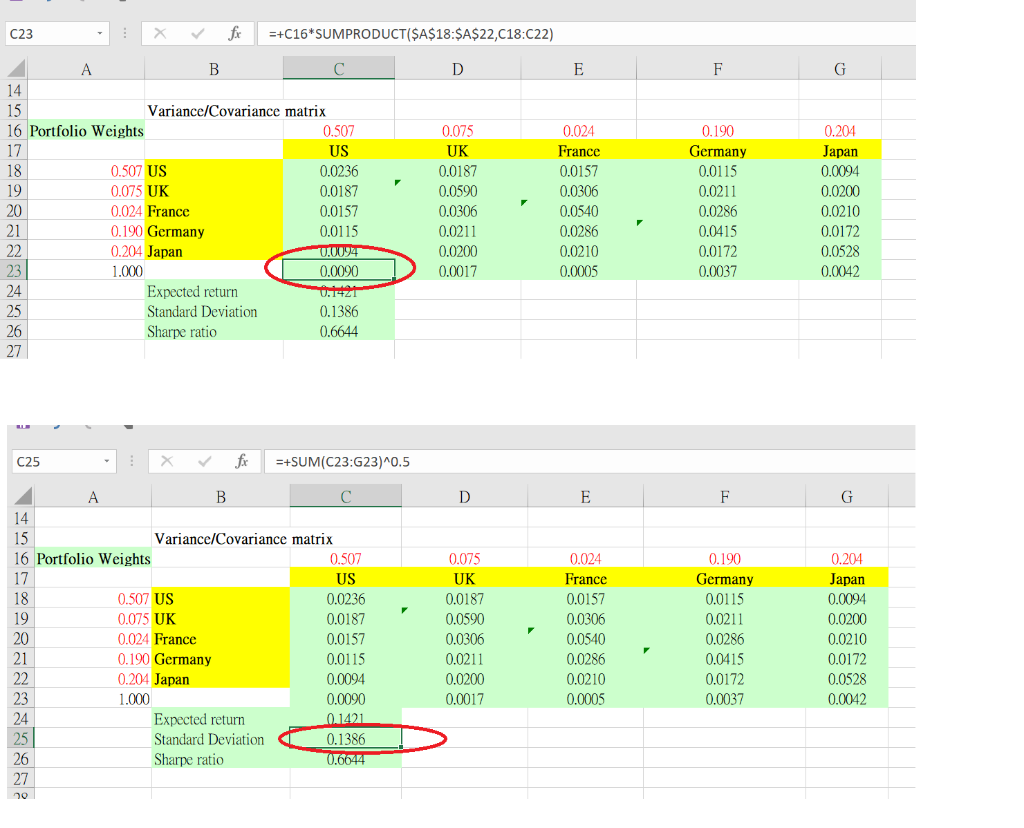
Cell C23= product of C16( which is the portfolio weight of US ) and sum of products of ($A$20:$A$25,C20:C25)
Cell D23 = D16*SUMPRODUCT($A$18:$A$22,D18:D22)
Cell G23 = G16*SUMPRODUCT($A$18:$A$22,G18:G22)
In calculating standard deviation in Cell C25, it equals square root of sum of cells C23 to G23
may I know is it wrong for the calculation? Because as I know, in calculating the standard deviation of a portfolio, we cannot just sum the variance up , but also need to include covariance value. In this case, in each cell from C23 to G23, the results obtained for each cell would be variance only.
THANKS!
C23 =+C16*SUMPRODUCT($A$18:$A$22,C18:022) D E F G A B 14 15 Variance/Covariance matrix 16 Portfolio Weights 0.507 17 US 18 0.507 US 0.0236 19 0.075 UK 0.0187 20. 0.024 France 0.0157 21 0.190 Germany 0.0115 22 0.204 Japan 0.0094 23 1.000 0.0090 24 Expected return 25 Standard Deviation 0.1386 26 Sharpe ratio 0.6644 27 0.075 UK 0.0187 0.0590 0.0306 0.0211 0.0200 0.0017 0.024 France 0.0157 0.0306 0.0540 0.0286 0.0210 0.0005 0.190 Germany 0.0115 0.0211 0.0286 0.0415 0.0172 0.0037 0.204 Japan 0.0094 0.0200 0.0210 0.0172 0.0528 0.0042 C25 fx =+SUM(C23:23)^0.5 D E F G A B 14 15 Variance/Covariance matrix 16 Portfolio Weights 0.507 17 US 18 0.507 US 0.0236 19 0.075 UK 0.0187 20 0.024 France 0.0157 21 0.190 Germany 0.0115 22 0.204 Japan 0.0094 23 1.000 0.0090 24 Expected return 0.1421 25 Standard Deviation 0.1386 26 Sharpe ratio 0.6044 27 0.075 UK 0.0187 0.0590 0.0306 0.0211 0.0200 0.0017 0.024 France 0.0157 0.0306 0.0540 0.0286 0.0210 0.0005 0.190 Germany 0.0115 0.0211 0.0286 0.0415 0.0172 0.0037 0.204 Japan 0.0094 0.0200 0.0210 0.0172 0.0528 0.0042 C23 =+C16*SUMPRODUCT($A$18:$A$22,C18:022) D E F G A B 14 15 Variance/Covariance matrix 16 Portfolio Weights 0.507 17 US 18 0.507 US 0.0236 19 0.075 UK 0.0187 20. 0.024 France 0.0157 21 0.190 Germany 0.0115 22 0.204 Japan 0.0094 23 1.000 0.0090 24 Expected return 25 Standard Deviation 0.1386 26 Sharpe ratio 0.6644 27 0.075 UK 0.0187 0.0590 0.0306 0.0211 0.0200 0.0017 0.024 France 0.0157 0.0306 0.0540 0.0286 0.0210 0.0005 0.190 Germany 0.0115 0.0211 0.0286 0.0415 0.0172 0.0037 0.204 Japan 0.0094 0.0200 0.0210 0.0172 0.0528 0.0042 C25 fx =+SUM(C23:23)^0.5 D E F G A B 14 15 Variance/Covariance matrix 16 Portfolio Weights 0.507 17 US 18 0.507 US 0.0236 19 0.075 UK 0.0187 20 0.024 France 0.0157 21 0.190 Germany 0.0115 22 0.204 Japan 0.0094 23 1.000 0.0090 24 Expected return 0.1421 25 Standard Deviation 0.1386 26 Sharpe ratio 0.6044 27 0.075 UK 0.0187 0.0590 0.0306 0.0211 0.0200 0.0017 0.024 France 0.0157 0.0306 0.0540 0.0286 0.0210 0.0005 0.190 Germany 0.0115 0.0211 0.0286 0.0415 0.0172 0.0037 0.204 Japan 0.0094 0.0200 0.0210 0.0172 0.0528 0.0042
Step by Step Solution
There are 3 Steps involved in it

Get step-by-step solutions from verified subject matter experts