

Question: Hello, the image below is the question, please explain the calculation. Assume the following activities for a project along with their estimated durations and predecessors.
Hello, the image below is the question, please explain the calculation.
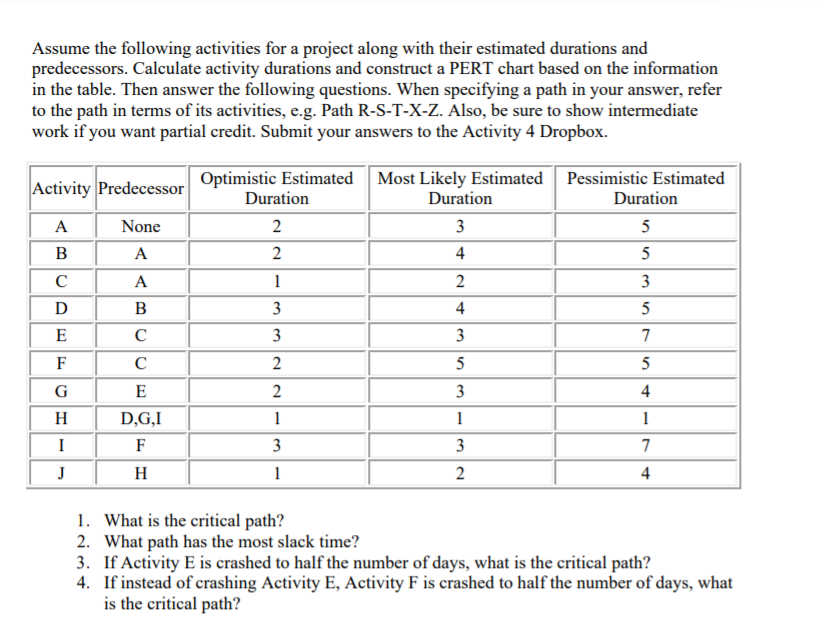
Assume the following activities for a project along with their estimated durations and predecessors. Calculate activity durations and construct a PERT chart based on the information in the table. Then answer the following questions. When specifying a path in your answer, refer to the path in terms of its activities, e.g. Path R-S-T-X-Z. Also, be sure to show intermediate work if you want partial credit. Submit your answers to the Activity 4 Dropbox. Activity Predecessor Optimistic Estimated Most Likely Estimated Pessimistic Estimated Duration Duration Duration A None 2 3 5 B A N A C A N D B E C 3 F C 2 W U W UI G E H D,G,I I F N W J H 1. What is the critical path? 2. What path has the most slack time? 3. If Activity E is crashed to half the number of days, what is the critical path? 4. If instead of crashing Activity E, Activity F is crashed to half the number of days, what is the critical path
Step by Step Solution
There are 3 Steps involved in it

Get step-by-step solutions from verified subject matter experts