

Question: Hello there again, I have another economics/math based question and have provided the question via image. (: 4. Discouraged workers and underemployed workers By keeping
Hello there again, I have another economics/math based question and have provided the question via image. (:


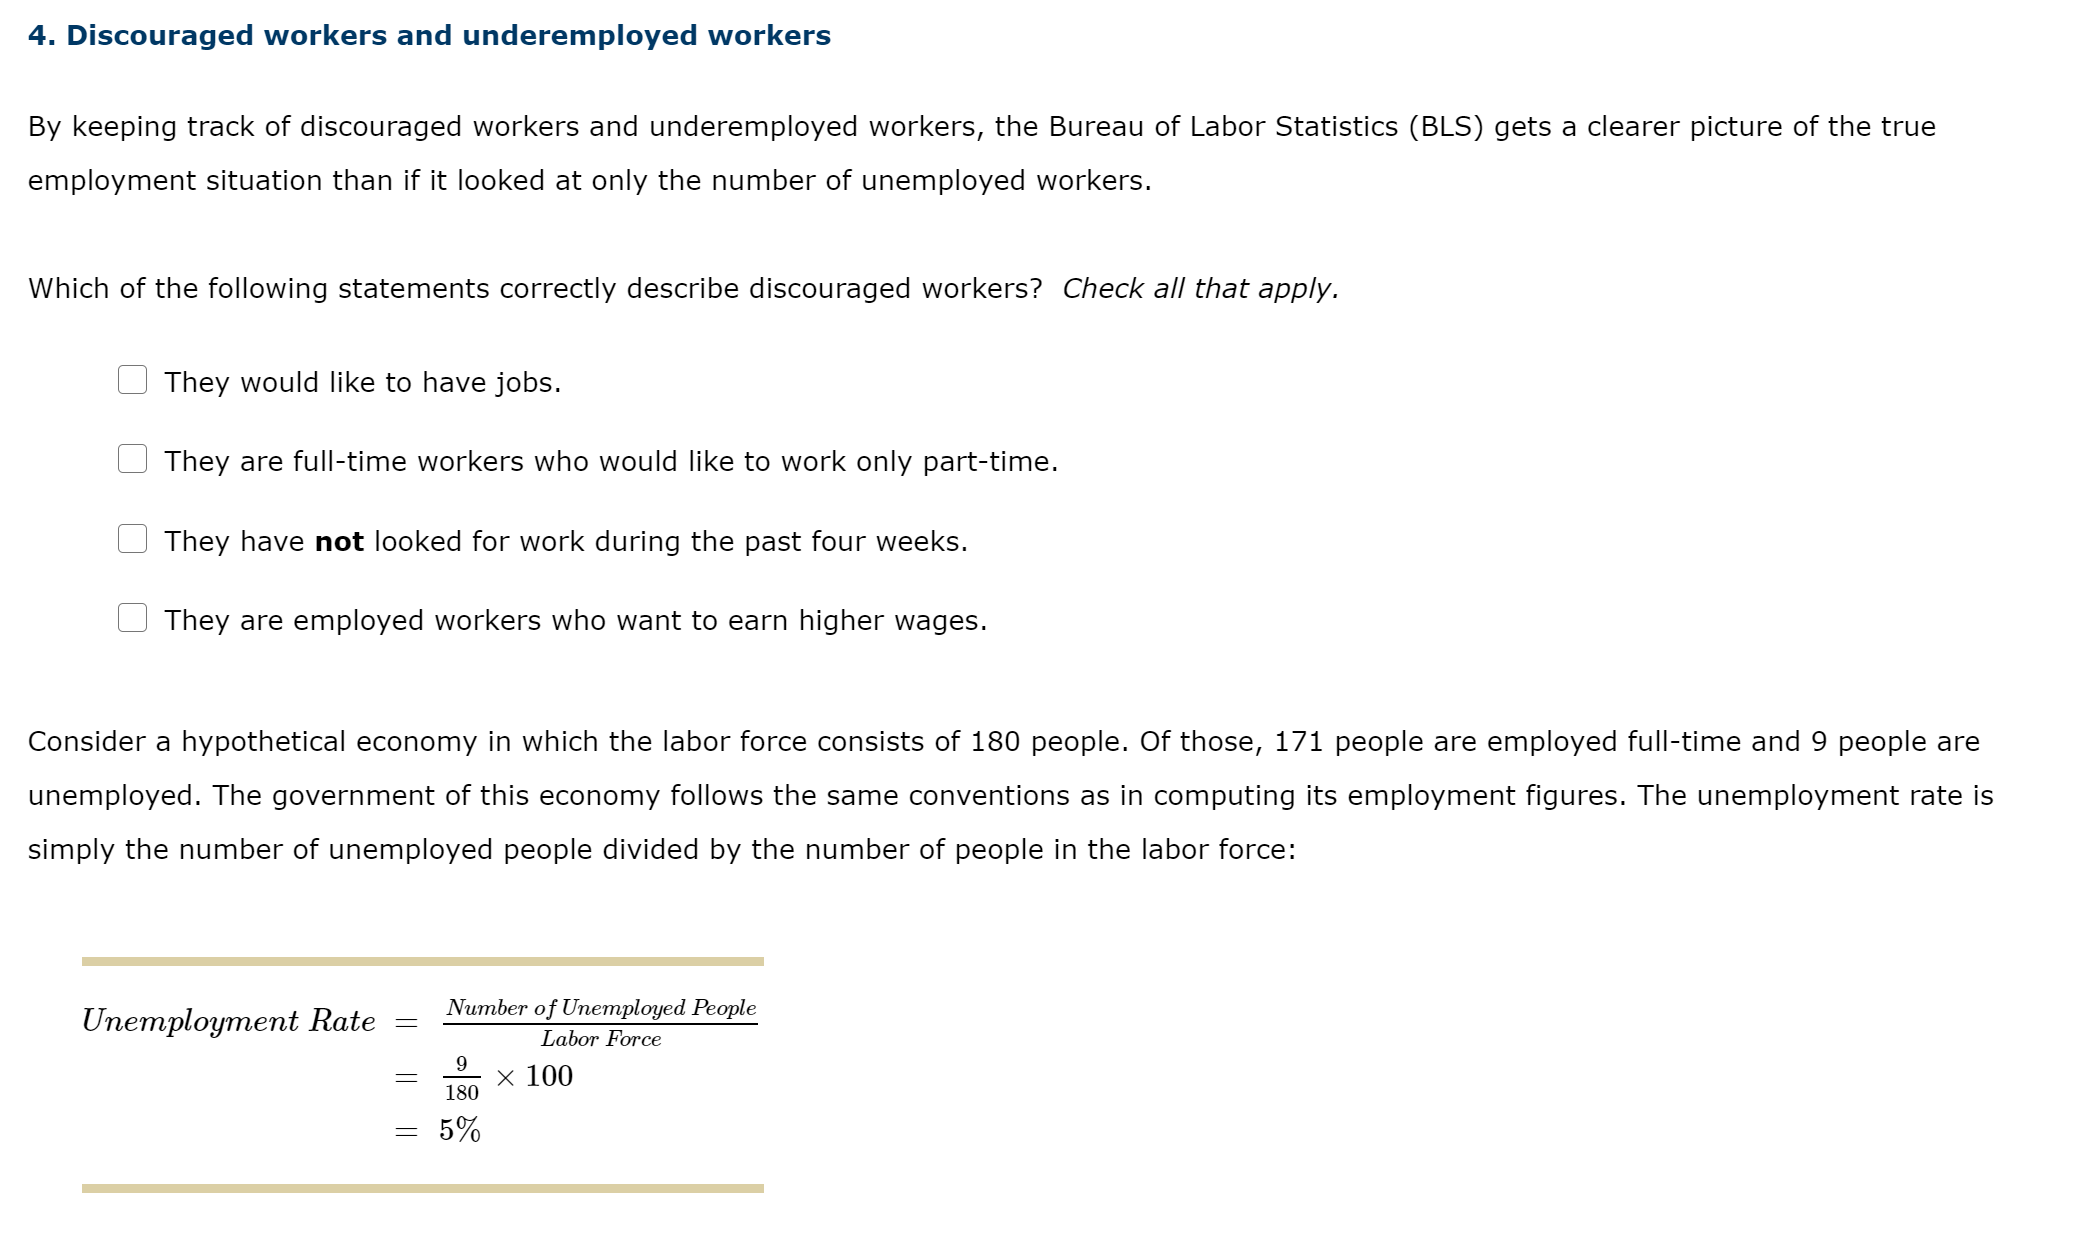
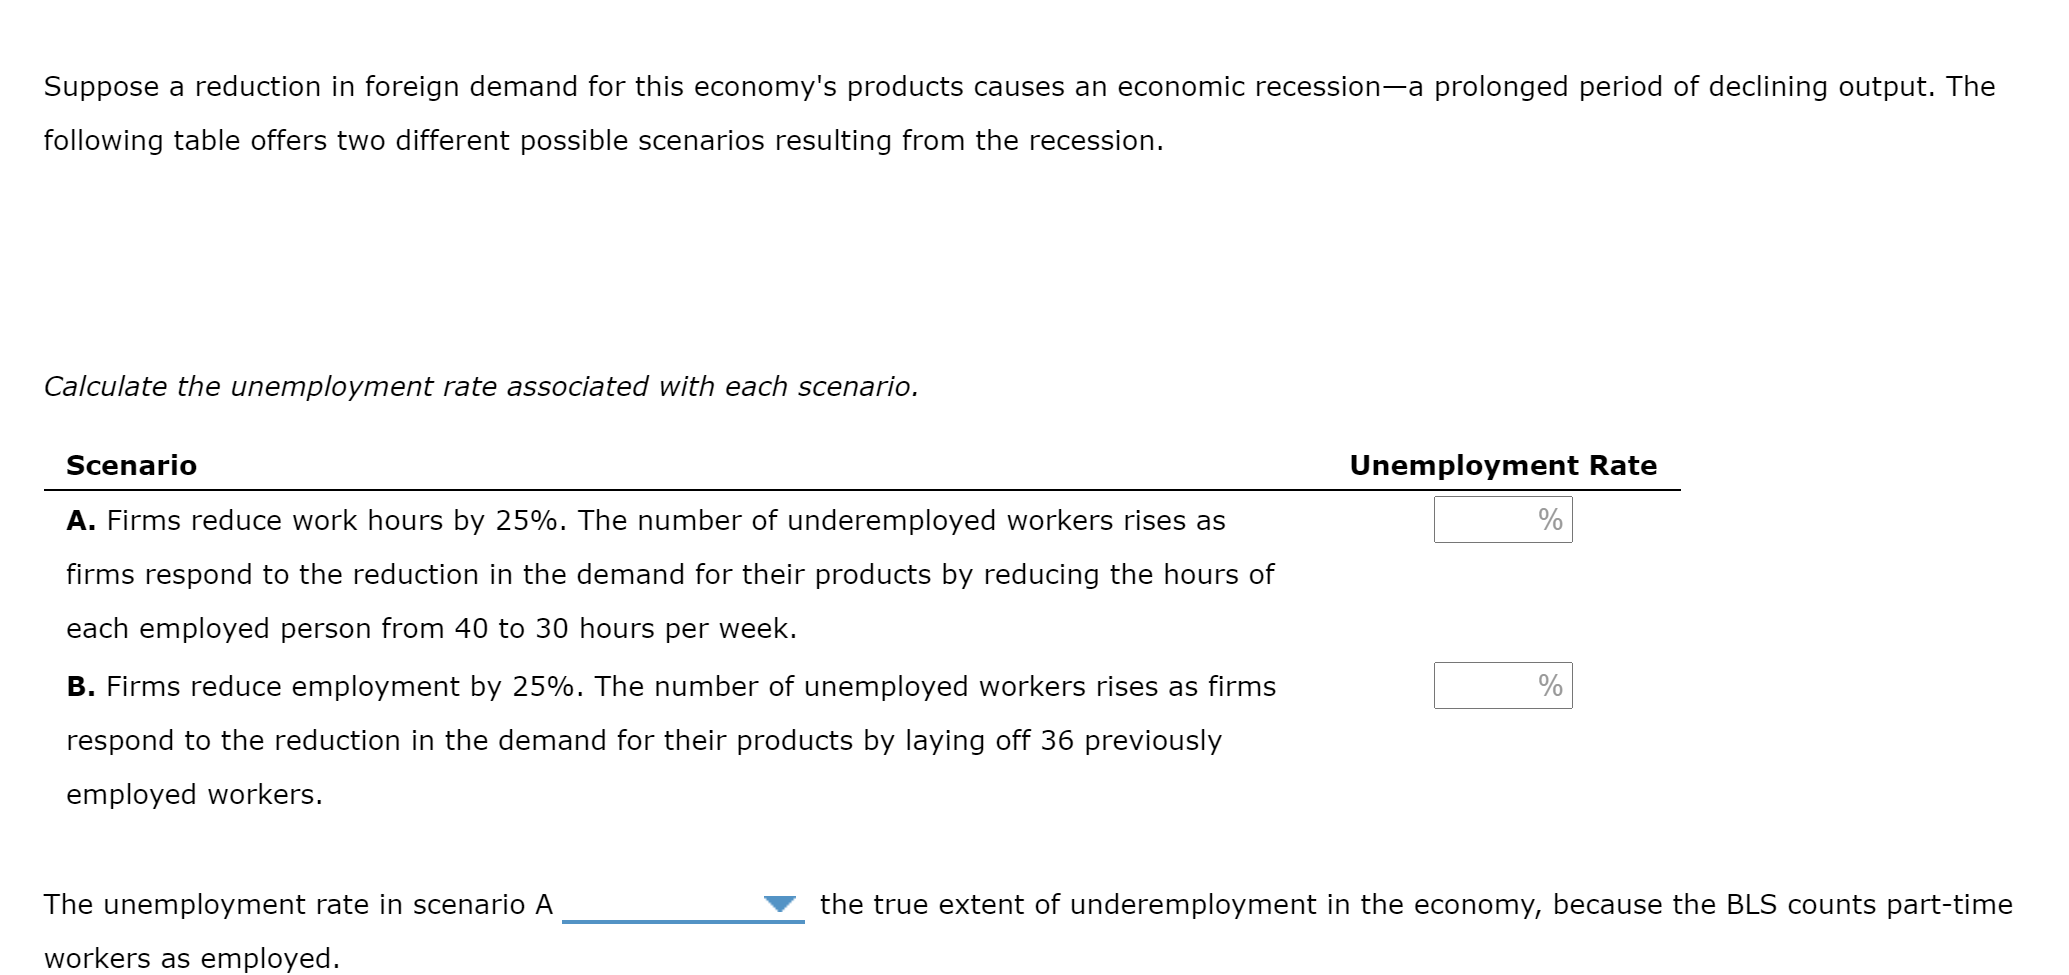
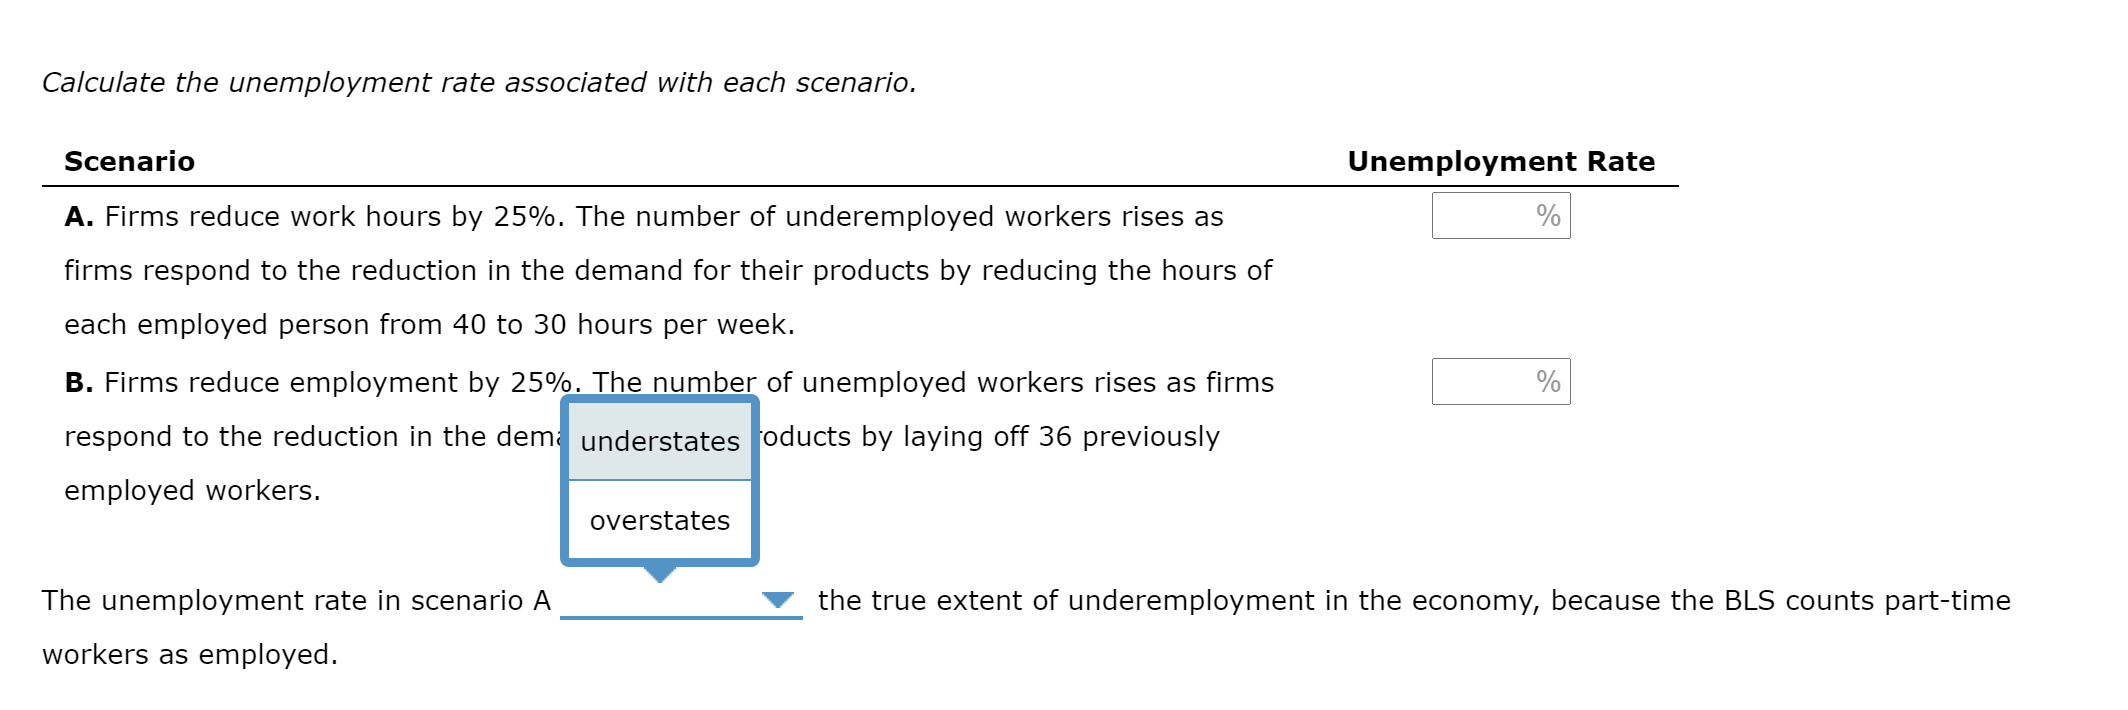
4. Discouraged workers and underemployed workers By keeping track of discouraged workers and underemployed workers, the Bureau of Labor Statistics (BLS) gets a clearer picture of the true employment situation than if it looked at only the number of unemployed workers. Which of the following statements correctly describe discouraged workers? Check all that apply. Cl They would like to have jobs. Cl They are full-time workers who would like to work only part-time. Cl They have not looked for work during the past four weeks. C] They are employed workers who want to earn higher wages. Consider a hypothetical economy in which the labor force consists of 180 people. Of those, 171 people are employed fulltime and 9 people are unemployed. The government of this economy follows the same conventions as in computing its employment figures. The unemployment rate is simply the number of unemployed people divided by the number of people in the labor force: Number of Unemployed People Labor Farce 7 i 7 180 X 100 :5% Unemployment Rate : Suppose a reduction in foreign demand for this economy's products causes an economic recessiona prolonged period of declining output. The following table offers two different possible scenarios resulting from the recession. Calculate the unemployment rate associated with each scenario. Scenario Unemployment Rate A. Firms reduce work hours by 25%. The number of underemployed workers rises as % firms respond to the reduction in the demand for their products by reducing the hours of each employed person from 40 to 30 hours per week. B. Firms reduce employment by 25%. The number of unemployed workers rises as firms % respond to the reduction in the demand for their products by laying off 36 previously employed workers. The unemployment rate in scenario A V the true extent of underemployment in the economy, because the BLS counts parttime workers as employed. Calculate the unemployment rate associated with each scenario. Scenario Unemployment Rate A. Firms reduce work hours by 25%. The number of underemployed workers rises as % firms respond to the reduction in the demand for their products by reducing the hours of each employed person from 40 to 30 hours per week. B. Firms reduce employment by 25%. The number of unemployed workers rises as firms % respond to the reduction in the dem understates oducts by laying off 36 previously employed workers. overstates The unemployment rate in scenario A V the true extent of underemployment in the economy, because the BLS counts parttime workers as employed
Step by Step Solution
There are 3 Steps involved in it

Get step-by-step solutions from verified subject matter experts