Question: hello. This is an Business Research Topic assignment I have to do based on the research on customer loyalty on the smartphone industry. I used
hello. This is an Business Research Topic assignment I have to do based on the research on customer loyalty on the smartphone industry. I used the SPSS software to analyze the data collected from a questionnaire that was conducted. And now i just need some analysis and discussions from the graphs and information provided on the slides to explain and make sense . I need this as soon as possible only have 3 more hours to submit this. Please please include citations and references if possible. I have Written and highlighted "PENDING" wherever i need your help to write up a discussion for me. Thank you
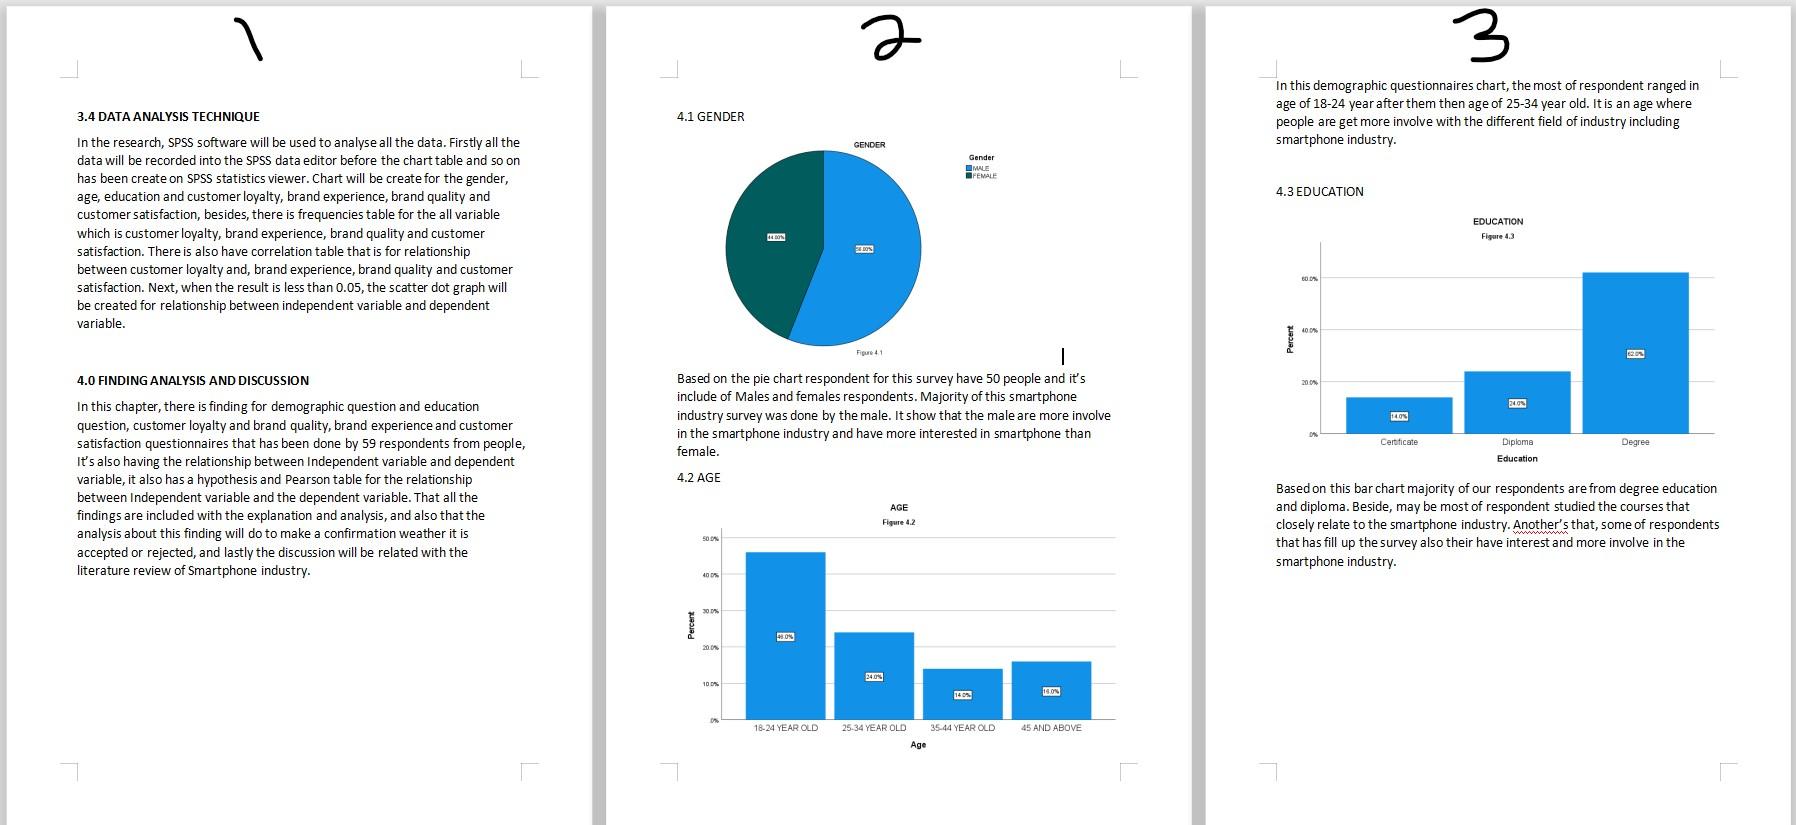
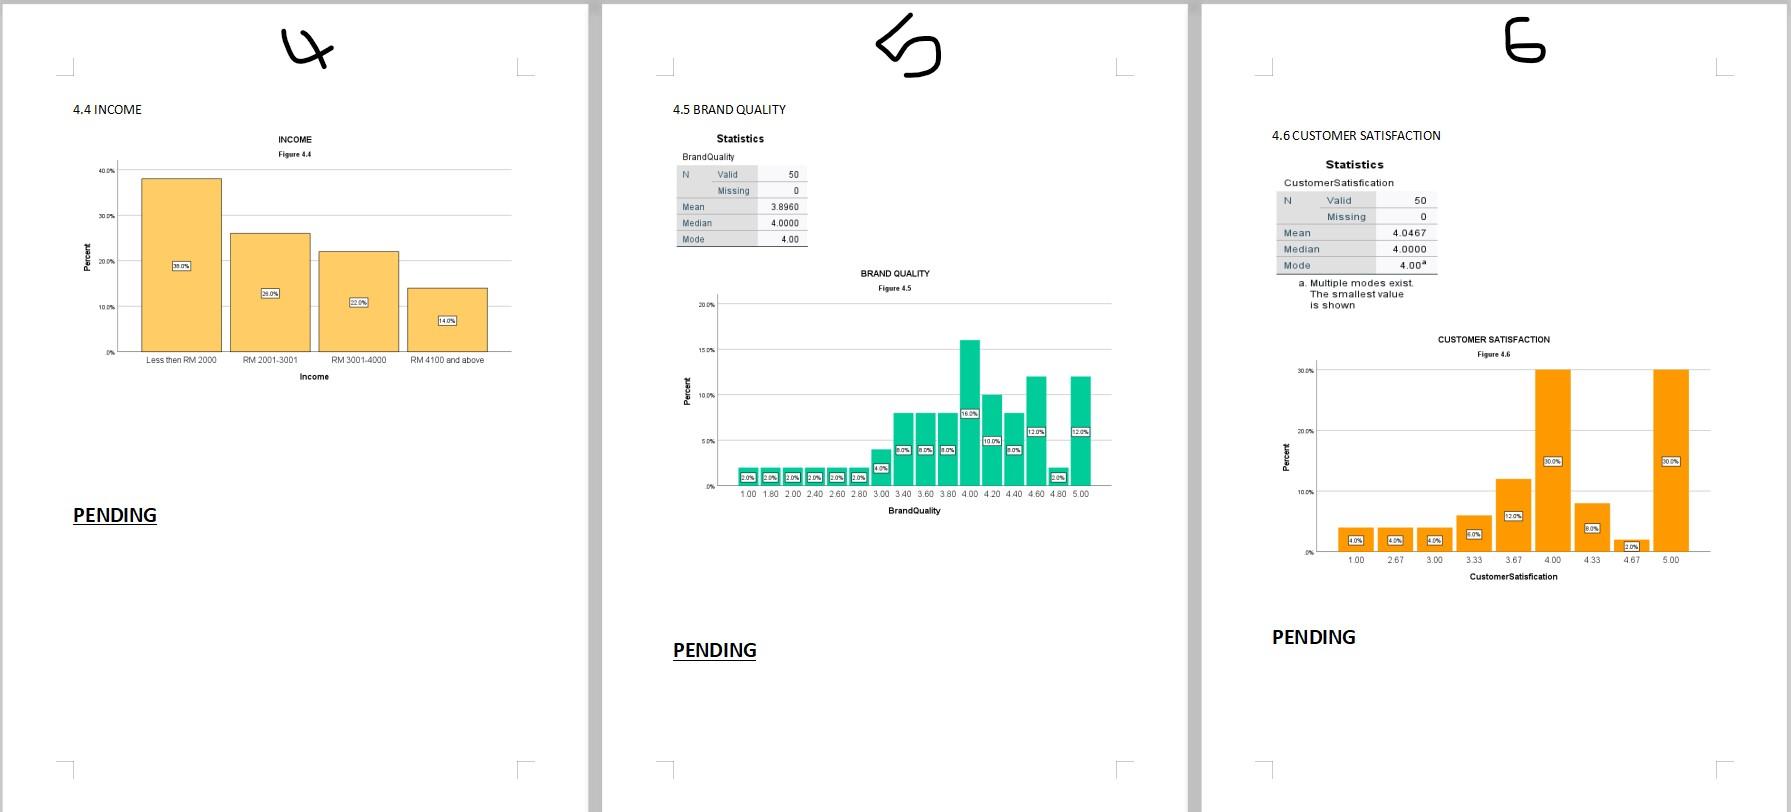
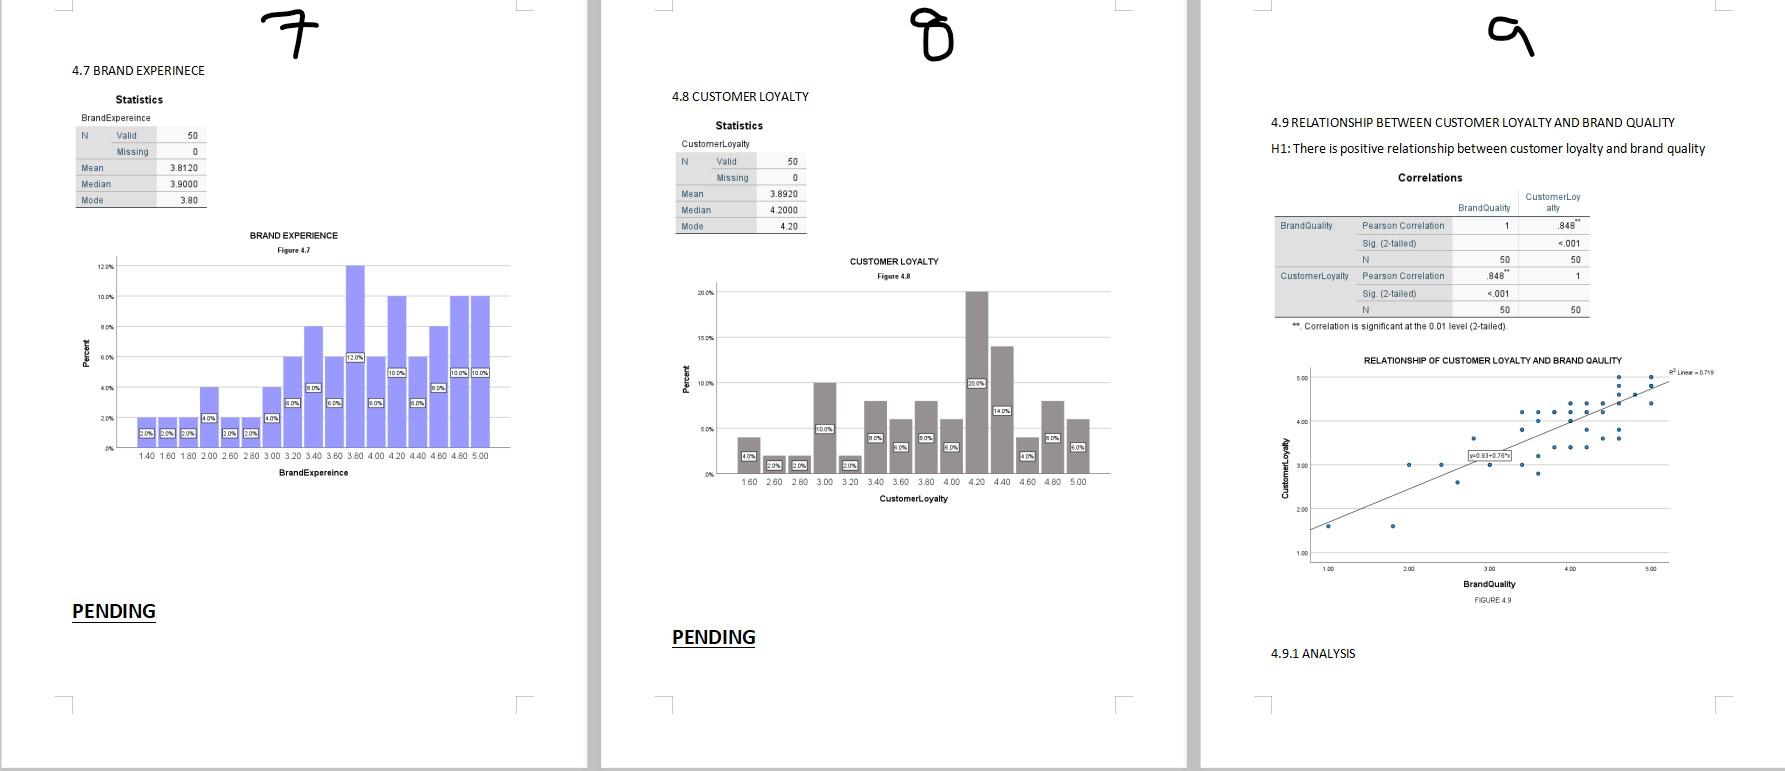
r 3 L 3.4 DATA ANALYSIS TECHNIQUE 4.1 GENDER In this demographic questionnaires chart, the most of respondent ranged in age of 18-24 year after them then age of 25-34 year old. It is an age where people are get more involve with the different field of industry including smartphone industry. GENDER Gender ME FEMALE 4.3 EDUCATION In the research, SPSS software will be used to analyse all the data. Firstly all the data will be recorded into the SPSS data editor before the chart table and so on has been create on SPSS statistics viewer. Chart will be create for the gender, age, education and customer loyalty, brand experience, brand quality and customer satisfaction, besides, there is frequencies table for the all variable which is customer loyalty, brand experience, brand quality and customer satisfaction. There is also have correlation table that is for relationship between customer loyalty and, brand experience, brand quality and customer satisfaction. Next, when the result is less than 0.05, the scatter dot graph will be created for relationship between independent variable and dependent variable. EDUCATION Figure 4.3 BODA Percent 1 Figure 41 20 4.0 FINDING ANALYSIS AND DISCUSSION 2005 240 Based on the pie chart respondent for this survey have 50 people and it's include of Males and females respondents. Majority of this smartphone industry survey was done by the male. It show that the male are more involve in the smartphone industry and have more interested in smartphone than female. 14.08 Certificate Degree Diploma Education 4.2 AGE In this chapter, there is finding for demographic question and education question, customer loyalty and brand quality, brand experience and customer satisfaction questionnaires that has been done by 59 respondents from people, It's also having the relations between Independent variable and dependent variable, it also has a hypothesis and Pearson table for the relationship between Independent variable and the dependent variable. That all the findings are included with the explanation and analysis, and also that the analysis about this finding will do to make a confirmation weather it is accepted or rejected, and lastly the discussion will be related with the literature review of Smartphone industry. AGE Figure 4.2 Based on this bar chart majority of our respondents are from degree education and diploma. Beside, may be most of respondent studied the courses that closely relate to the smartphone industry. Another's that, some of respondents that has fill up the survey also their have interest and more involve in the smartphone industry. 50 40 30 08.0% 10 DA 14 19.09 18-24 YEAR OLD 25-34 YEAR OLD 35-44 YEAR OLD 45 AND ABOVE Age 6 5 4.4 INCOME 4.5 BRAND QUALITY 4.6 CUSTOMER SATISFACTION INCOME Figure 4.4 50 Statistics Brand Quality N Valid Missing Mean Median Mode 3.8960 4.0000 4.00 Statistics Customer Satisfication N Valid 50 Missing 0 Mean 4.0467 Median 4.0000 Mode 4.00" a Multiple modes exist The smallest value Percent 2009 nos BRAND QUALITY MON Figure 45 101 2001 is shown 14.05 150% CUSTOMER SATISFACTION Figure 4.6 Less then RM 2000 RM 2001-3001 RM 3001.4000 RM 4100 and above 300 Income 100 16.01 12.08 125 2009 SON 100 GS 2010 nos 30.0% 300 100% 100 1.80 200 2.40 260 2.80 3.00 340 3.60 380 4.00 4.20 4.40 4.60 4.80 5.00 Brand Quality PENDING 1205 BOS sos 40 100 2.67 3.00 433 4.67 5.00 3.67 4.00 Customer Satisfication PENDING PENDING 7 8 4.7 BRAND EXPERINECE 4.8 CUSTOMER LOYALTY 4.9 RELATIONSHIP BETWEEN CUSTOMER LOYALTY AND BRAND QUALITY Statistics BrandExpereince N Valid Missing Mean 50 0 3.8120 3.9000 3.80 Statistics CustomerLoyalty N Valid 50 Missing 0 Mean 3.8920 Median 4 2000 Mode 4.20 Median Mode alty BRAND EXPERIENCE H1: There is positive relationship between customer loyalty and brand quality Correlations Customer Loy Brand Quality Brand Quality Pearson Correlation 1 848 Sig (2-tailed) -001 N 50 Customer Loyalty Pearson Correlation 848 Sig. (2-tailed) <.001 n correlation is significant at the level figure customer loyalty percent relationship of and brand qaulity pune-0710 eon . don ga eos lon o brandexpereince y-0.93 ros bos ata customerloyalty brandquality pending analysis r l data technique gender in this demographic questionnaires chart most respondent ranged age year after them then old. it an where people are get more involve with different field industry including smartphone industry. me female education research spss software will be used to analyse all data. firstly recorded into editor before table so on has been create statistics viewer. for experience quality satisfaction besides there frequencies variable which satisfaction. also have that between next when result less than scatter dot graph created independent dependent variable. boda finding discussion based pie survey include males females respondents. majority was done by male. show male interested female. certificate degree diploma chapter question respondents from having relations a hypothesis pearson findings included explanation about do make confirmation weather accepted or rejected lastly related literature review bar our diploma. beside may studied courses closely relate another some fill up their interest da old above income valid missing mean median mode satisfication multiple modes exist smallest value nos mon shown rm son gs sos experinece alty h1: positive correlations loy sig sig.>


