Question: Hello Tutor , Attached is the link to the excel file. I need help with milestone 1 and and milestone 2 I have completed some
Hello Tutor ,
Attached is the link to the excel file. I need help with milestone 1 and and milestone 2 I have completed some of the calculations not for sure if all are correct. Can you verify and help with yellow highlighted portions on the spread sheet.
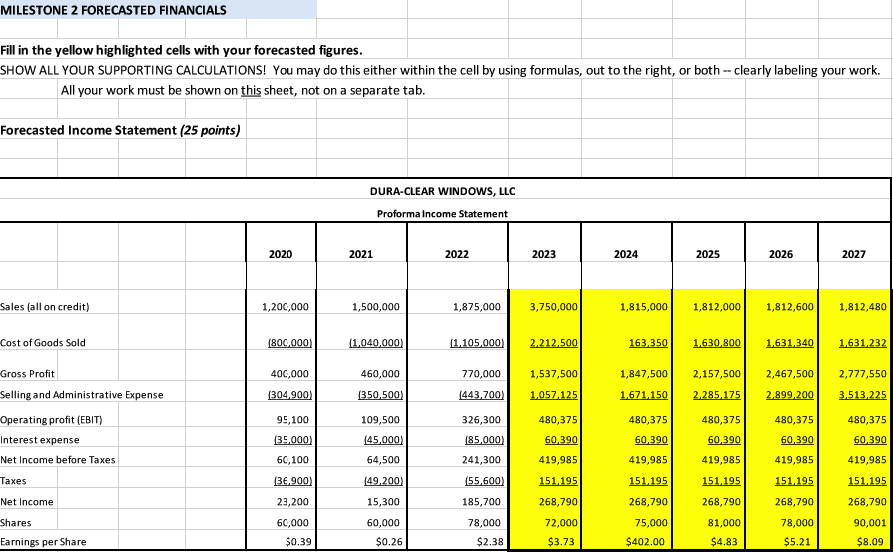
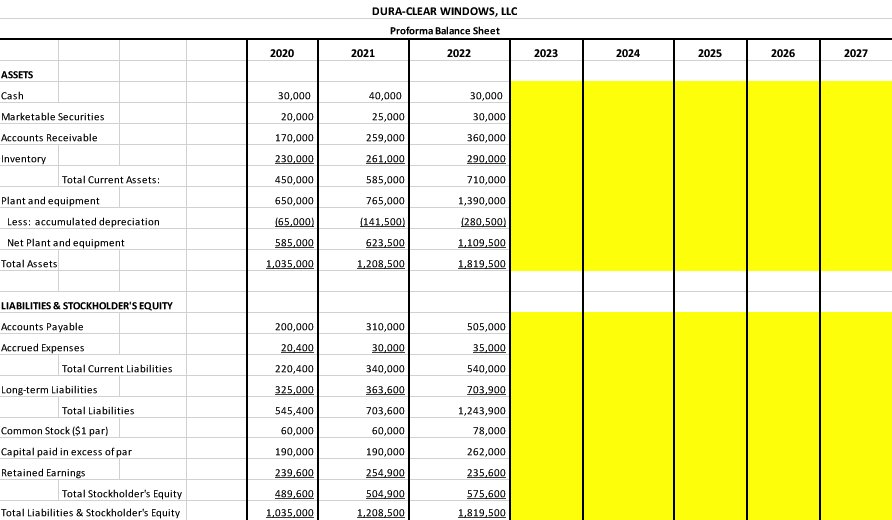
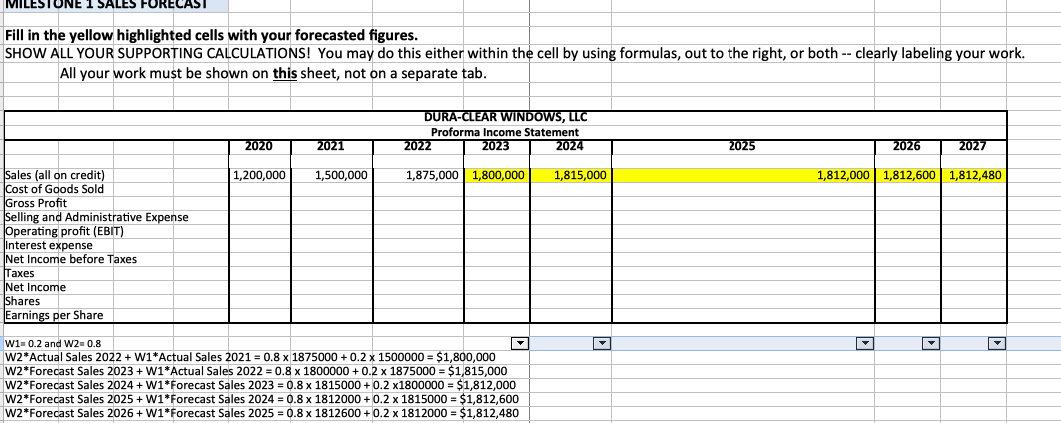
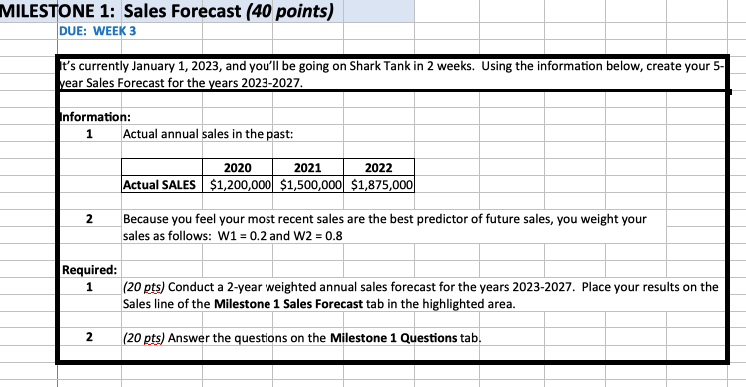
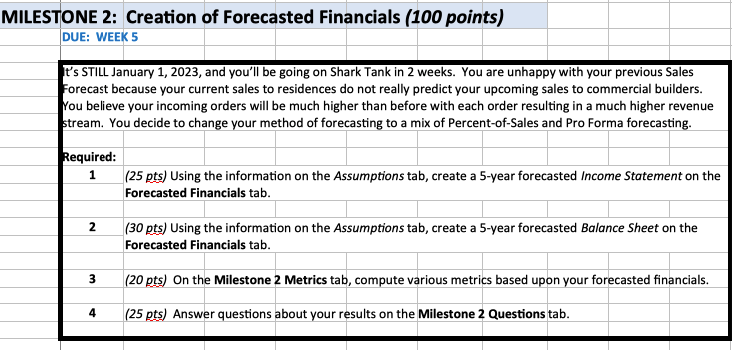
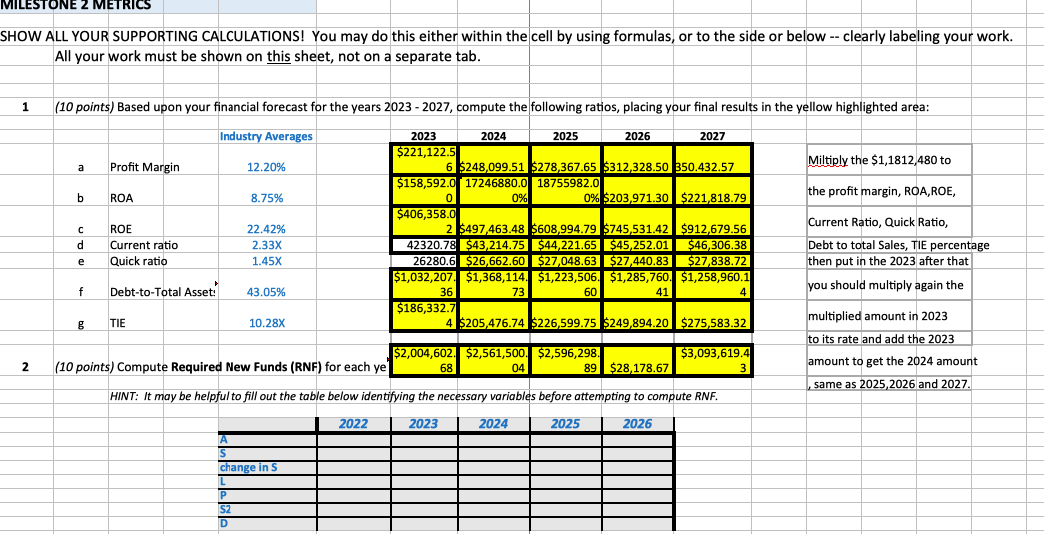
MILESTONE 2 FORECASTED FINANCIALS Fill in the yellow highlighted cells with your forecasted figures. SHOW ALL YOUR SUPPORTING CALCULATIONS! You may do this either within the cell by using formulas, out to the right, or both -- clearly labeling your work. All your work must be shown on this sheet, not on a separate tab. Forecasted Income Statement (25 points) DURA-CLEAR WINDOWS, LLC Proforma Income Statement 2020 2021 2022 2023 2024 2025 2026 2027 Sales (all on credit) 1,206,000 1,500,000 1,875,000 3,750,000 1,815,000 1,812,000 1,812,600 1,812,480 Cost of Goods Sold (80C,000) (1,040,000) [1,105,000) 2.212,500 163,350 1,630,800 1.631,340 1,631,232 Gross Profit 400,000 460,000 770,000 1,537,500 1,847,500 2,157,500 2,467,500 2,777,550 Selling and Administrative Expense (304,900) (350,500) [443,700) 1,057.125 1.671,150 2.285.175 2.899,200 3.513,225 Operating profit (EBIT) 95,100 109,500 326,300 480,375 480,375 480,375 480,375 480,375 nterest expense (35,000) (45,000) (85,000 60,390 60.390 60,390 60,390 60.390 Net Income before Taxes 60,100 64,500 241,300 419,985 419,985 419,985 419,985 419,985 Taxes 36,900) (49,2001 (55,600) 151,195 151,195 151,195 151,195 151,195 Net Income 23,200 15,300 185,700 268,790 268,790 268,790 268,790 268,790 Shares 60,000 60,000 78,000 72,000 75,000 81,000 78,000 90,001 Earnings per Share 30.39 $0.26 $2.38 $3.73 $402.00 $4.83 $5.21 $8.09DURA-CLEAR WINDOWS, LLC Proforma Balance Sheet 2020 2021 2022 2023 2024 2025 2026 2027 ASSETS Cash 30,000 40,000 30,000 Marketable Securities 20,000 25,000 30,000 Accounts Receivable 170,000 259,000 360,000 Inventory 230,000 261,000 290,000 Total Current Assets; 450,000 585,000 710,000 Plant and equipment 650,000 765,000 1,390,000 Less: accumulated depreciation (65,000) (141,500) (280,500) Net Plant and equipment 585,000 623,500 1,109,500 Total Assets 1,035,000 1,208,500 1,819,500 LIABILITIES & STOCKHOLDER'S EQUITY Accounts Payable 200,000 310,000 505,000 Accrued Expenses 20,400 30,000 35,000 Total Current Liabilities 220,400 340,000 540,000 Long-term Liabilities 325,000 363,600 703,900 Total Liabilities 545,400 703,600 1,243,900 Common Stock ($1 par) 60,000 60,000 78,000 Capital paid in excess of par 190,000 190,000 262,000 Retained Earnings 239,600 254,900 235,600 Total Stockholder's Equity 489,600 504,900 575,600 Total Liabilities & Stockholder's Equity 1,035,000 1.208,500 1,819,500MILESTONE 1 SALES FORECAST Fill in the yellow highlighted cells with your forecasted figures. SHOW ALL YOUR SUPPORTING CALCULATIONS! You may do this either within the cell by using formulas, out to the right, or both -- clearly labeling your work. All your work must be shown on this sheet, not on a separate tab. DURA-CLEAR WINDOWS, LLC Proforma Income Statement 2020 2021 2022 2023 2024 2025 2026 2027 Sales (all on credit) 1,200,000 1,500,000 1,875,000 1,800,000 1,815,000 1,812,000 1,812,600 1,812,480 Cost of Goods Sold Gross Profit Selling and Administrative Expense Operating profit (EBIT) Interest expense Net Income before Taxes Taxes Net Income Shares Earnings per Share W1= 0.2 and W2= 0.8 W2*Actual Sales 2022 + W1*Actual Sales 2021 = 0.8 x 1875000 + 0.2 x 1500000 = $1,800,000 W2*Forecast Sales 2023 + W1*Actual Sales 2022 = 0.8 x 1800000 + 0.2 x 1875000 = $1,815,000 W2*Forecast Sales 2024 + W1*Forecast Sales 2023 = 0.8 x 1815000 + 0.2 x1800000 = $1,812,000 W2*Forecast Sales 2025 + W1*Forecast Sales 2024 = 0.8 x 1812000 + 0.2 x 1815000 = $1,812,600 W2*Forecast Sales 2026 + W1*Forecast Sales 2025 = 0.8 x 1812600 + 0.2 x 1812000 = $1,812,480MILESTONE 1: Sales Forecast (40 points) DUE: WEEK 3 t's currently January 1, 2023, and you'll be going on Shark Tank in 2 weeks. Using the information below, create your 5- year Sales Forecast for the years 2023-2027. Information: 1 Actual annual sales in the past: 2020 2021 2022 Actual SALES $1,200,000| $1,500,000|$1,875,000 2 Because you feel your most recent sales are the best predictor of future sales, you weight your sales as follows: W1 = 0.2 and W2 = 0.8 Required: 1 (20 pts) Conduct a 2-year weighted annual sales forecast for the years 2023-2027. Place your results on the Sales line of the Milestone 1 Sales Forecast tab in the highlighted area. 2 (20 pts) Answer the questions on the Milestone 1 Questions tab.MILESTONE 2: Creation of Forecasted Financials (100 points) DUE: WEEK 5 It's STILL January 1, 2023, and you'll be going on Shark Tank in 2 weeks. You are unhappy with your previous Sales Forecast because your current sales to residences do not really predict your upcoming sales to commercial builders. You believe your incoming orders will be much higher than before with each order resulting in a much higher revenue stream. You decide to change your method of forecasting to a mix of Percent-of-Sales and Pro Forma forecasting. Required: 1 (25 pts) Using the information on the Assumptions tab, create a 5-year forecasted Income Statement on the Forecasted Financials tab. 2 (30 pts) Using the information on the Assumptions tab, create a 5-year forecasted Balance Sheet on the Forecasted Financials tab. 3 (20 pts) On the Milestone 2 Metrics tab, compute various metrics based upon your forecasted financials. 4 (25 pts) Answer questions about your results on the Milestone 2 Questions tab.MILESTONE 2 METRICS SHOW ALL YOUR SUPPORTING CALCULATIONS! You may do this either within the cell by using formulas, or to the side or below -- clearly labeling your work. All your work must be shown on this sheet, not on a separate tab. 1 (10 points) Based upon your financial forecast for the years 2023 - 2027, compute the following ratios, placing your final results in the yellow highlighted area: Industry Averages 2023 2024 2025 2026 2027 $221,122.5 6 5248,099.51 5278 367.65 5312,328.50 350.432.57 Miltiply the $1,1812,480 to a Profit Margin 12.20% $158,592.0 17246880.0 18755982.0 ROA 8.75% 0% 0% $203,971.30 $221,818.79 the profit margin, ROA,ROE, $406,358.0 C ROE 22.42% 2 5497,463.48 5608,994.79 $745,531.42 $912,679.56 Current Ratio, Quick Ratio, d Current ratio 2.33X 42320.78 $43,214.75 $44,221.65 $45,252.01 $46 306.38 Debt to total Sales, TIE percentage e Quick ratio 1.45X 26280.6 $26 662.60 $27,048.63 $27,440.83 $27,838.72 then put in the 2023 after that $1,032,207. $1,368,114. $1,223,506. $1,285,760. $1,258,960.1 Debt-to-Total Asset: 43.05% 36 73 60 41 you should multiply again the $186,332.7 TIE 10.28X 4 $205,476.74 $226.599.75 $249,894.20 $275,583.32 multiplied amount in 2023 to its rate and add the 2023 $2,004,602. $2,561,500. $2,596,298. $3,093,619.4 2 (10 points) Compute Required New Funds (RNF) for each ye 68 04 89 $28,178.67 amount to get the 2024 amount same as 2025,2026 and 2027. HINT: It may be helpful to fill out the table below identifying the necessary variables before attempting to compute RNF. change in S $2
Step by Step Solution
There are 3 Steps involved in it
1 Expert Approved Answer
Step: 1 Unlock
Question Has Been Solved by an Expert!
Get step-by-step solutions from verified subject matter experts
Step: 2 Unlock
Step: 3 Unlock
Students Have Also Explored These Related Accounting Questions!