

Question: Hello tutor, Please explain step by step how to solve these problem. I'm really confuse. I have been watching video on Youtube how to solve
Hello tutor, Please explain step by step how to solve these problem. I'm really confuse. I have been watching video on Youtube how to solve these problems, but i still don't understand. Please help. Thank you.
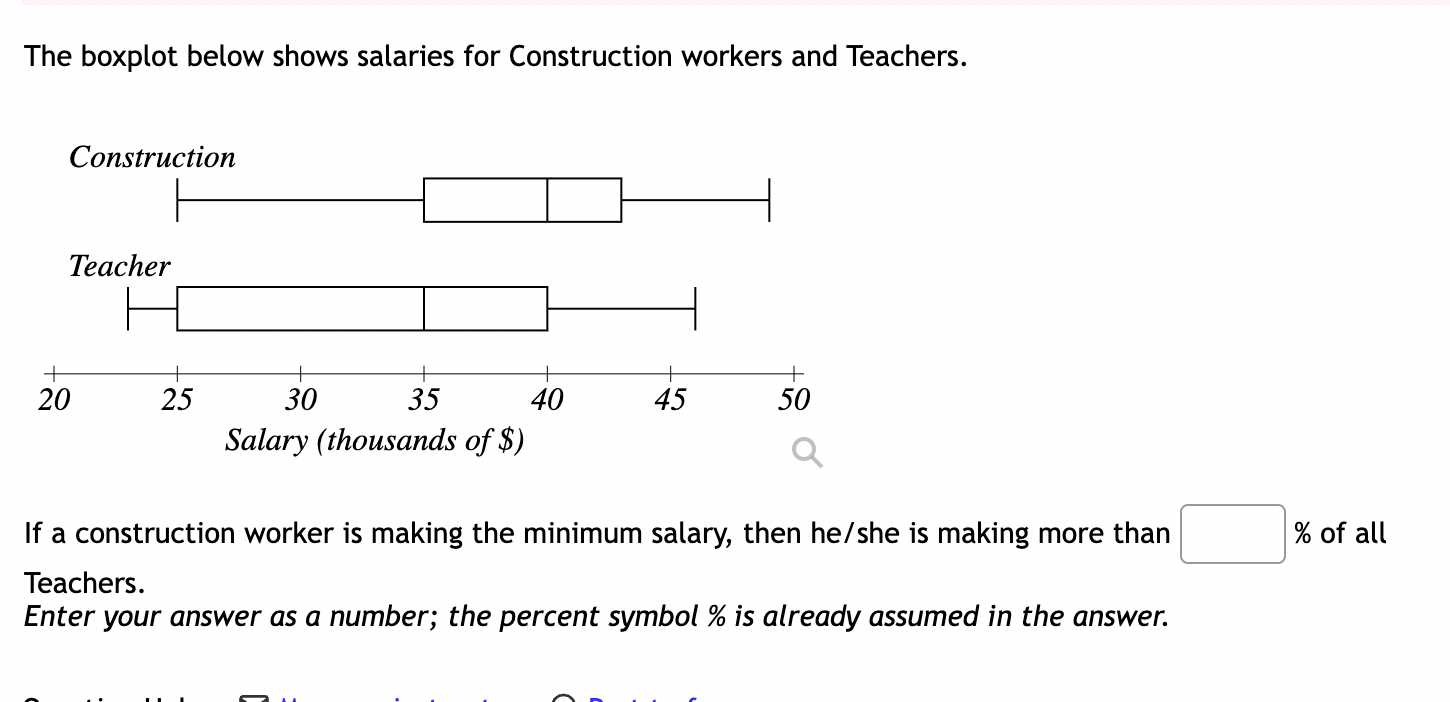
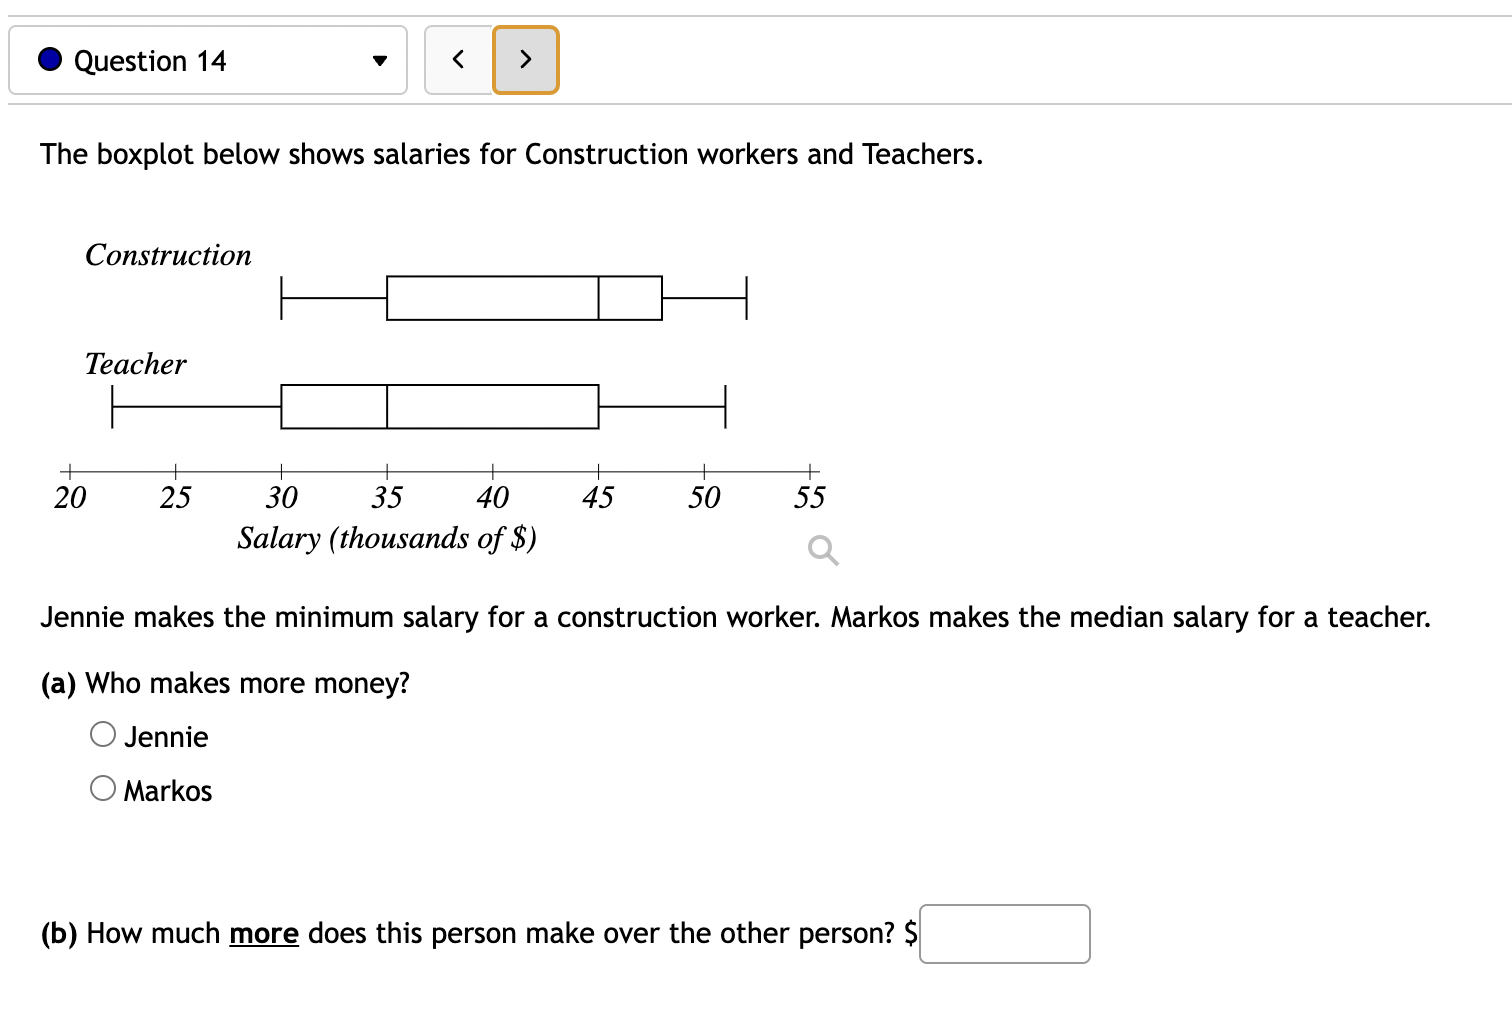
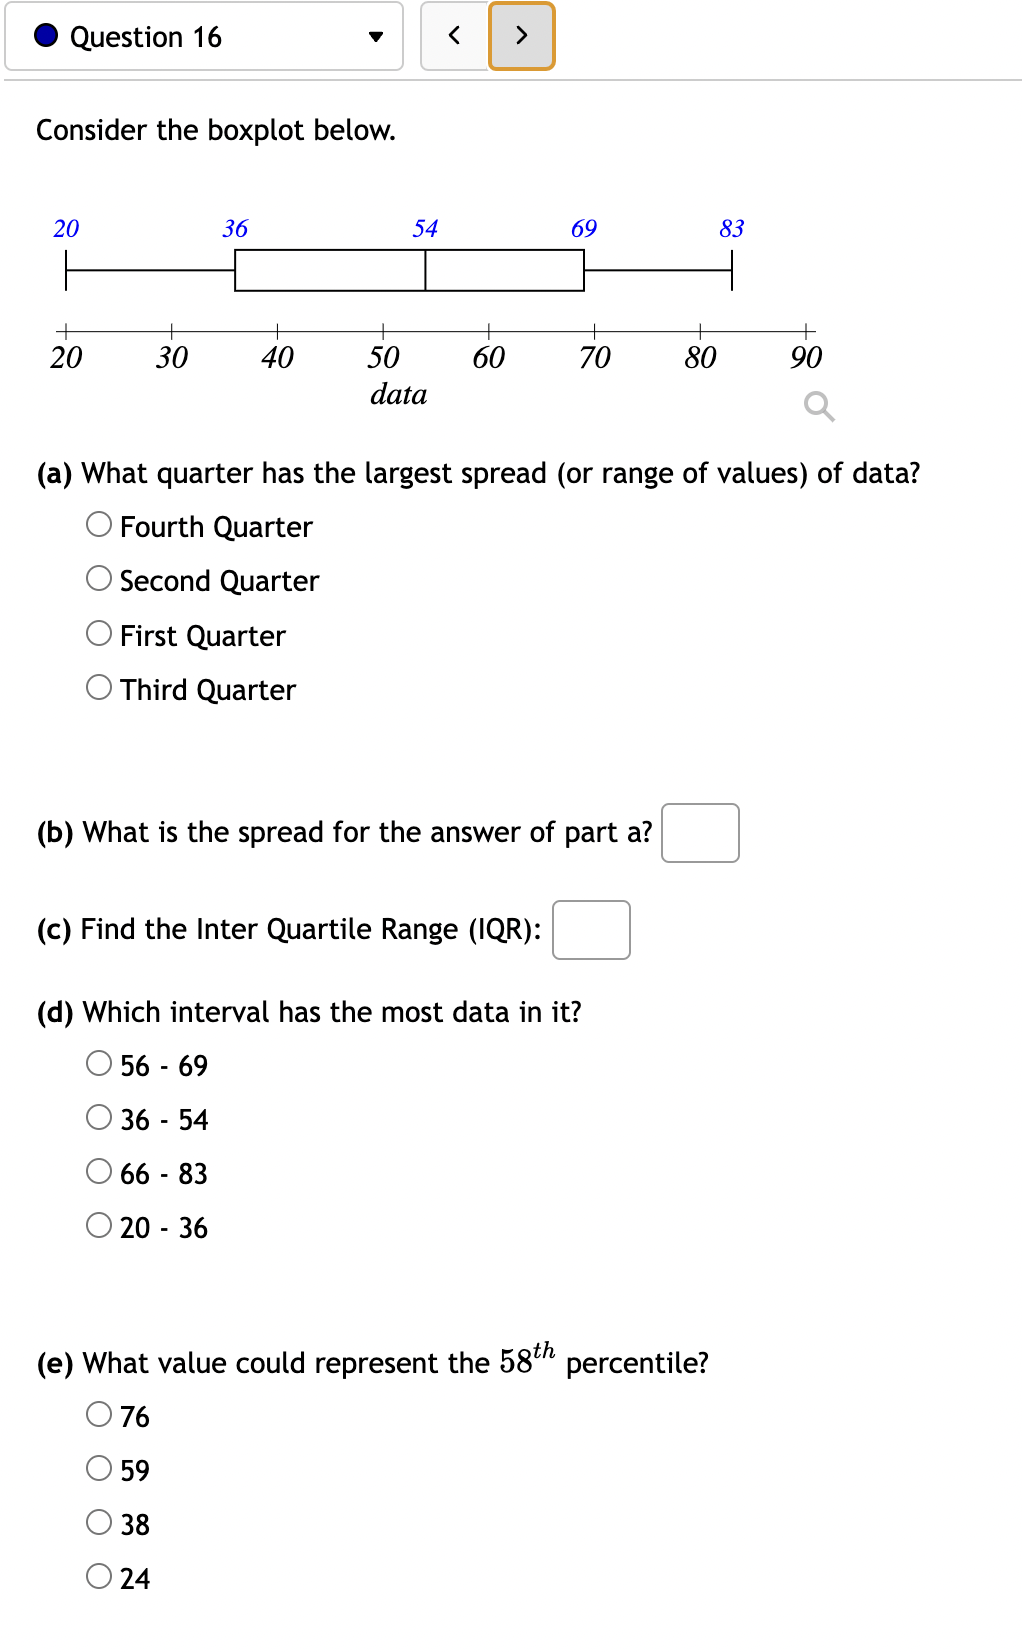
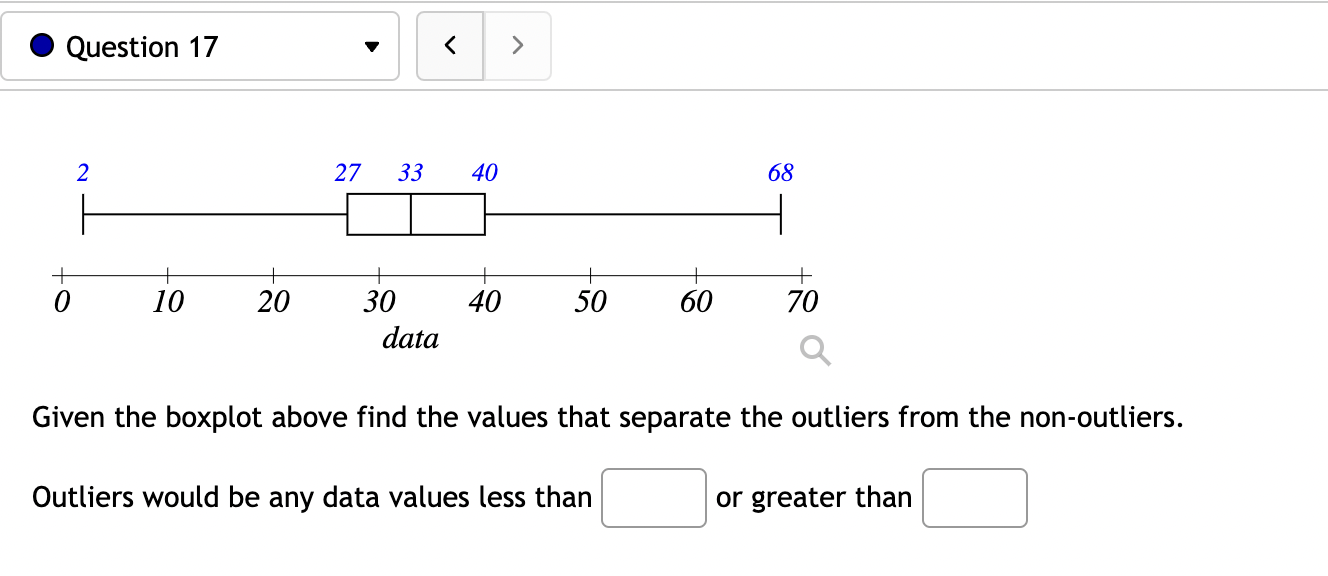
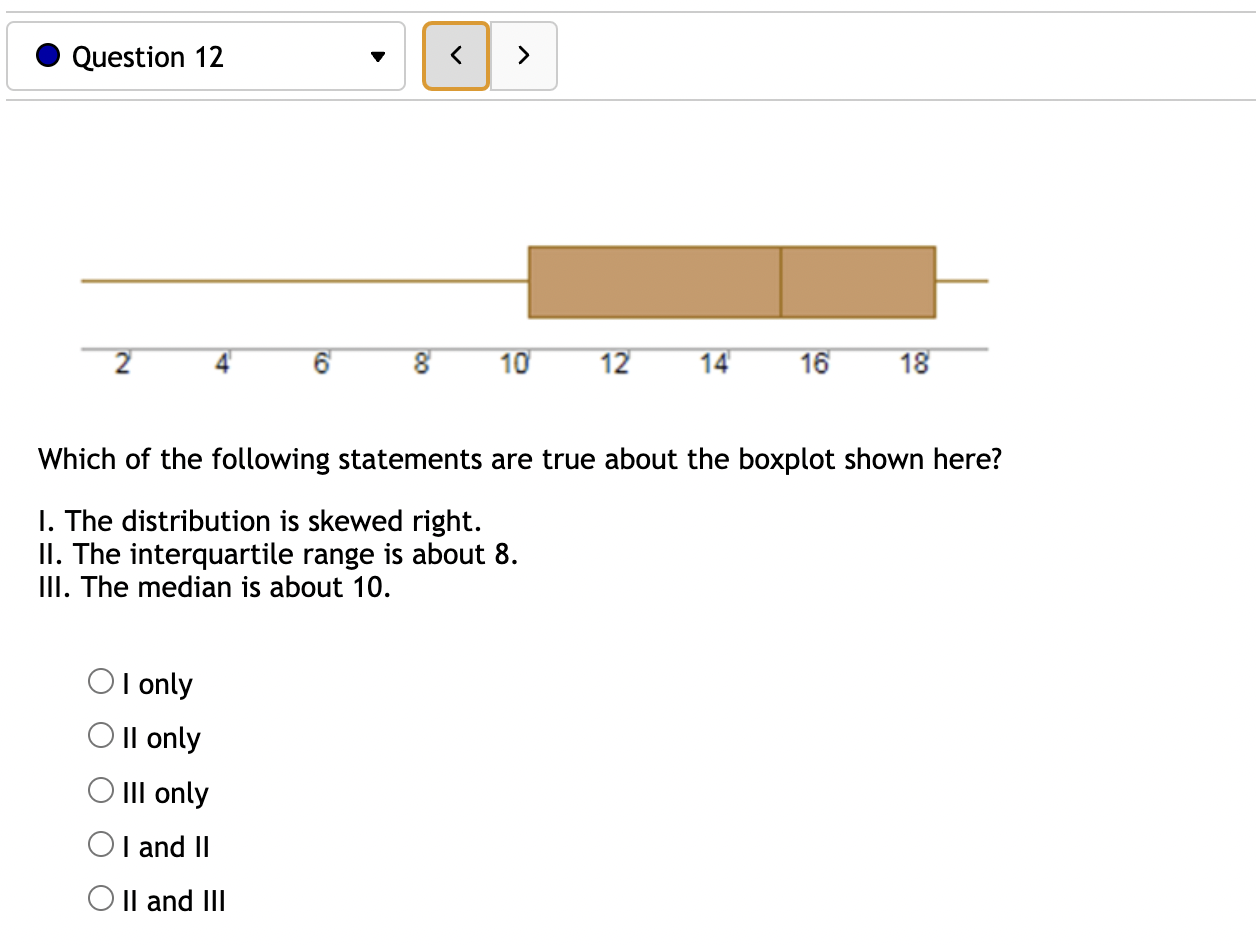
The boxplot below shows salaries for Construction workers and Teachers. Construction % Teacher F:El 4 I I I I I r 20 25 30 35 40 45 50 Salary (thousands of 3 ) If a construction worker is making the minimum salary, then he/she is making more than % of all Teachers. Enter your answer as a number; the percent symbol % is already assumed in the answer. 0 Question 14 v The boxplot below shows salaries for Construction workers and Teachers. Construction Teacher 4 i i I i l I r 20 25 30 35 40 45 50 55 Salary ( thousands of $) Jennie makes the minimum salary for a construction worker. Markos makes the median salary for a teacher. (a) Who makes more money? O Jennie O Markos (b) How much more does this person make over the other person? 5 0 Question 16 v Consider the boxplot below. 20 36 54 69 83 I i i i i i i I 20 30 40 50 60 70 80 90 data (a) What quarter has the largest spread (or range of values) of data? 0 Fourth Quarter O Second Quarter O First Quarter 0 Third Quarter (b) What is the spread for the answer of part a? (c) Find the Inter Quartile Range (IQR): (d) Which interval has the most data in it? Q 56 - 69 O 36 - 54 O 66 - 83 O 20 - 36 (e) What value could represent the 58th percentile? 076 059 033 024 Question 17 > N 27 33 40 68 + 0 10 20 30 40 50 60 70 data Q Given the boxplot above find the values that separate the outliers from the non-outliers. Outliers would be any data values less than or greater than0 Question 12 v > - 2' 4' (:'rT 8' 1U 17? 14' 'IB' 178' Which of the following statements are true about the boxplot shown here? |. The distribution is skewed right. ||. The interquartile range is about 8. III. The median is about 10. O I only 0 || only O "I only OI and ll 0 II and Ill
Step by Step Solution
There are 3 Steps involved in it

Get step-by-step solutions from verified subject matter experts