

Question: Hello, would you please help me work these questions regardless of the data? for a) how would I know what type of graph to use
Hello,
would you please help me work these questions regardless of the data? for a) how would I know what type of graph to use for what data? for b and c) how do we code these and how do we interpret confidence interval or describe the center and spread and finally d) what confidence interval would be reasonable compared to the 4.6%?
Thank you in advance! Please no vague answers! Will rate! :) 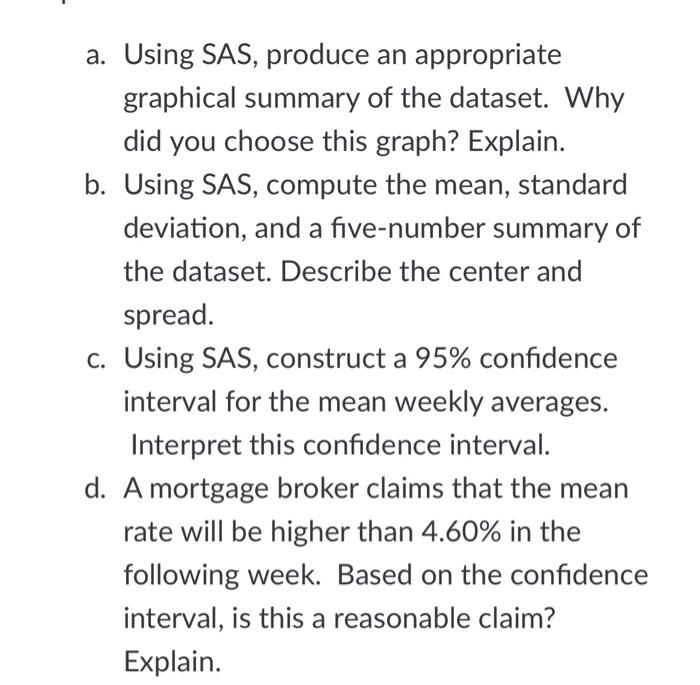
a. Using SAS, produce an appropriate graphical summary of the dataset. Why did you choose this graph? Explain. b. Using SAS, compute the mean, standard deviation, and a five-number summary of the dataset. Describe the center and spread. c. Using SAS, construct a 95\% confidence interval for the mean weekly averages. Interpret this confidence interval. d. A mortgage broker claims that the mean rate will be higher than 4.60% in the following week. Based on the confidence interval, is this a reasonable claim? Explain
Step by Step Solution
There are 3 Steps involved in it
1 Expert Approved Answer
Step: 1 Unlock

Question Has Been Solved by an Expert!
Get step-by-step solutions from verified subject matter experts
Step: 2 Unlock
Step: 3 Unlock