

Question: Help 5 points) The table shows the minimum wage rates for the United States during different years. Year 1978 1979 1980 1990 1991 1996 1997
Help
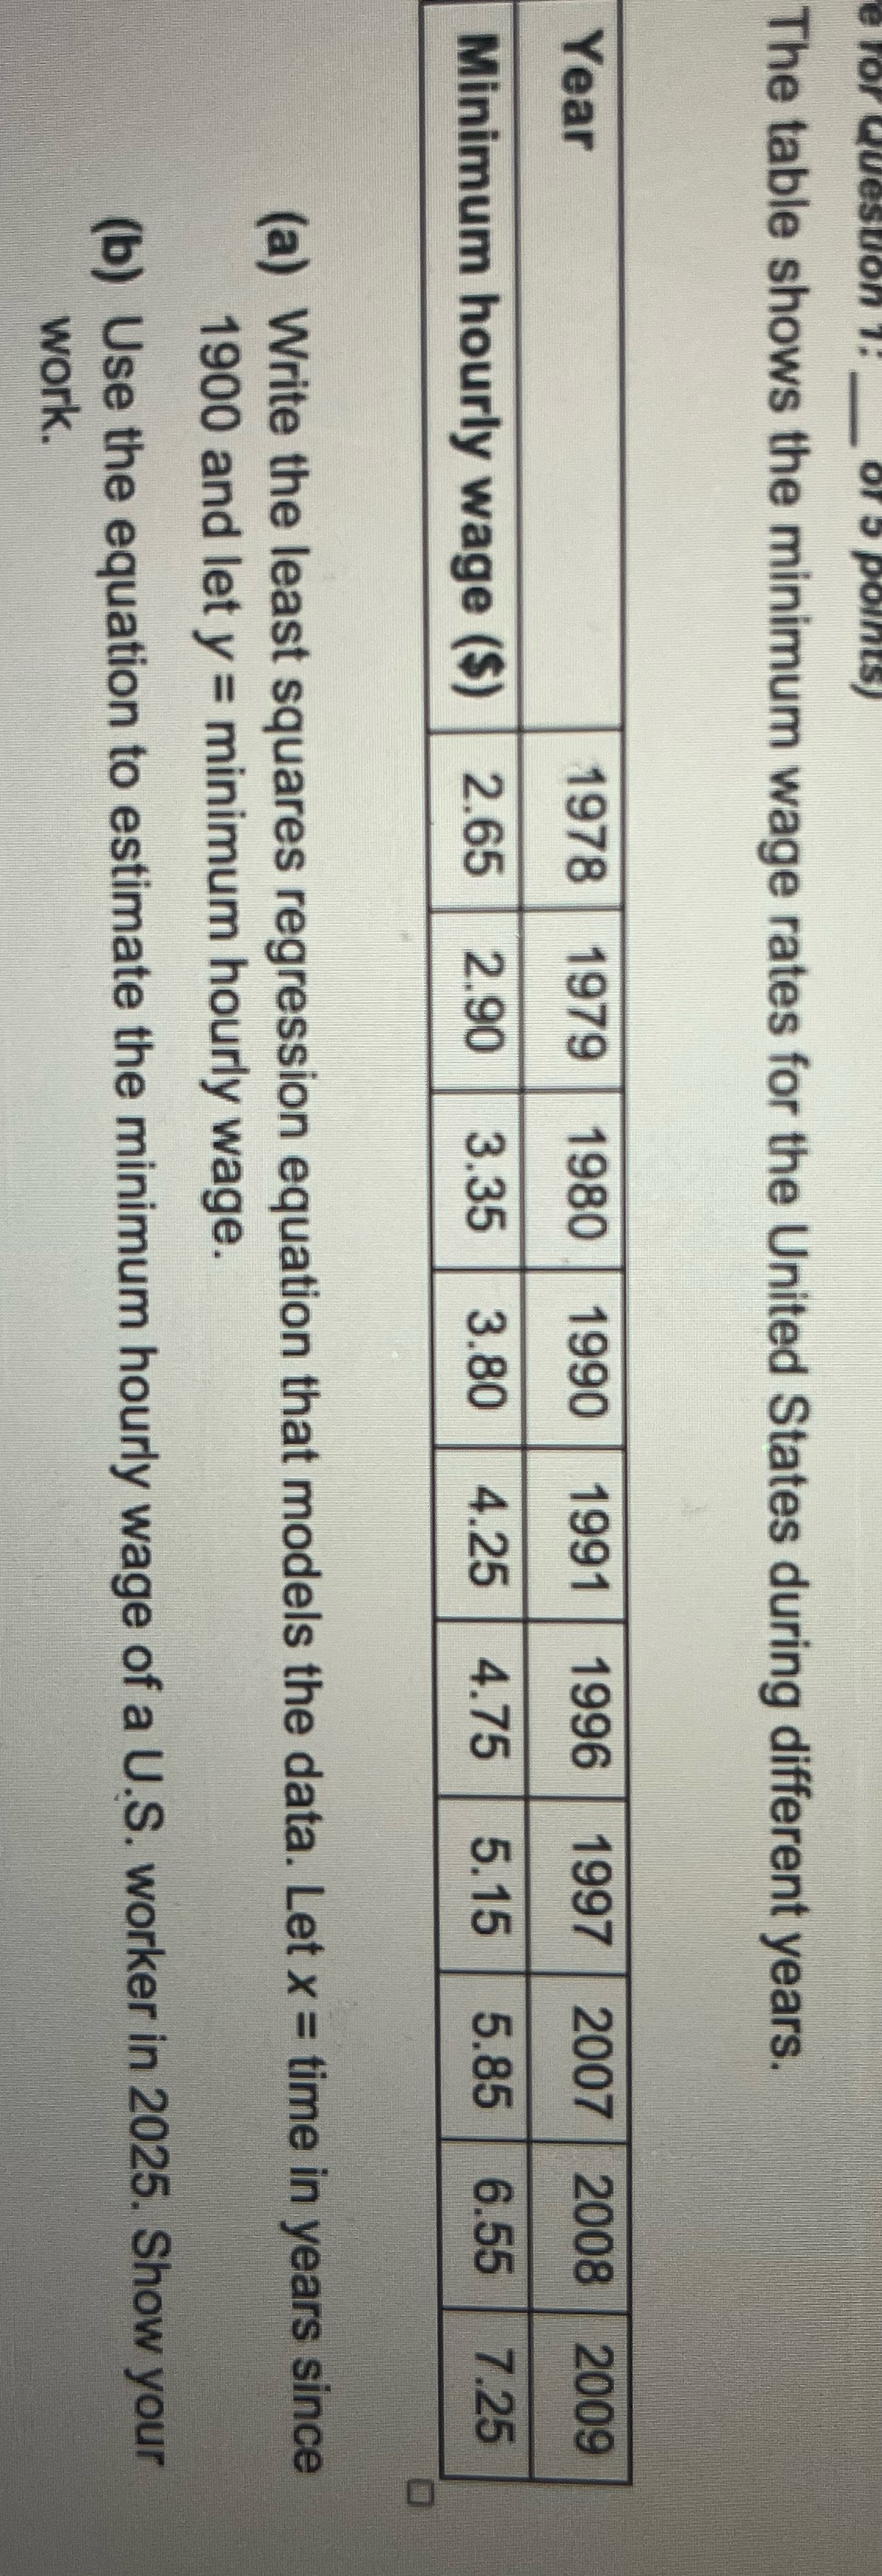
5 points) The table shows the minimum wage rates for the United States during different years. Year 1978 1979 1980 1990 1991 1996 1997 2007 2008 2009 Minimum hourly wage ($) 2.65 2.90 3.35 3.80 4.25 4.75 5.15 5.85 6.55 7.25 O (a) Write the least squares regression equation that models the data. Let x = time in years since 1900 and let y = minimum hourly wage. (b) Use the equation to estimate the minimum hourly wage of a U.S. worker in 2025. Show your work
Step by Step Solution
There are 3 Steps involved in it
1 Expert Approved Answer
Step: 1 Unlock

Question Has Been Solved by an Expert!
Get step-by-step solutions from verified subject matter experts
Step: 2 Unlock
Step: 3 Unlock