

Question: I need help with this math problem in the photo! Please teach me!!!!!!!! The table shows the minimum wage rates for the United States during
I need help with this math problem in the photo! Please teach me!!!!!!!!
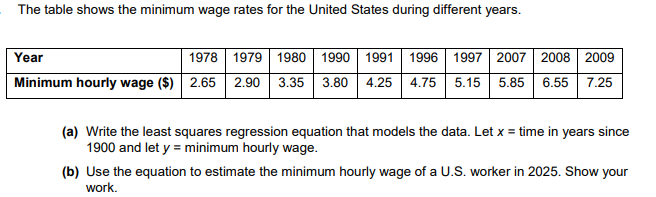
The table shows the minimum wage rates for the United States during different years. Year 1978 1979 1980 1990 1991 1996 1997 2007 2008 2009 Minimum hourly wage ($) 2.65 2.90 3.35 3.80 4.25 4.75 5.15 5.85 6.55 7.25 (a) Write the least squares regression equation that models the data. Let x = time in years since 1900 and let y = minimum hourly wage. (b) Use the equation to estimate the minimum hourly wage of a U.S. worker in 2025. Show your work
Step by Step Solution
There are 3 Steps involved in it
1 Expert Approved Answer
Step: 1 Unlock

Question Has Been Solved by an Expert!
Get step-by-step solutions from verified subject matter experts
Step: 2 Unlock
Step: 3 Unlock