Question: help and please show equations please thank you! Level 1 - Analyzing Sales for Crmes Ice Cream Judd Hemming is the eastern regional marketing manager
help and please show equations please thank you!
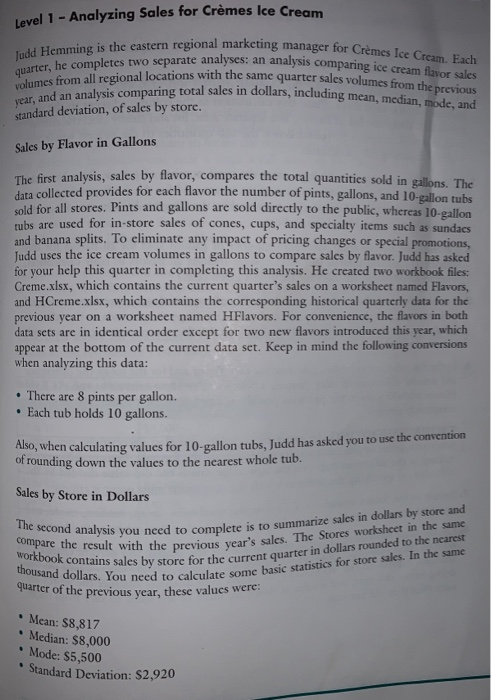
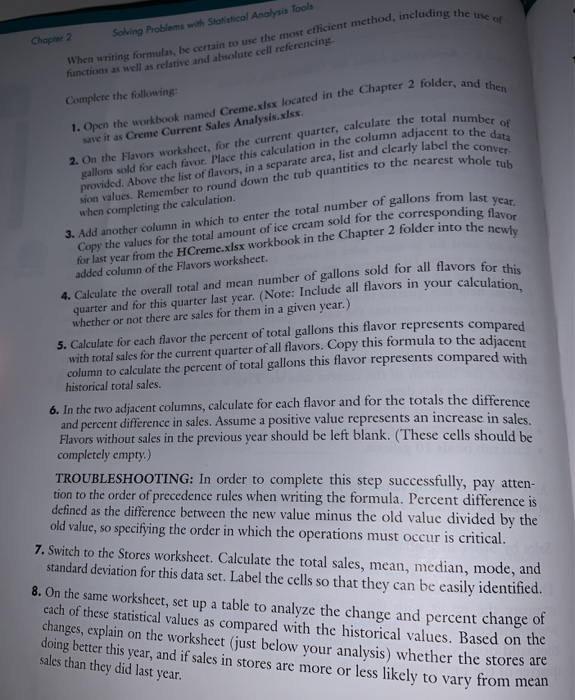
Level 1 - Analyzing Sales for Crmes Ice Cream Judd Hemming is the eastern regional marketing manager for Cremes Ice Cream. Each volumes from all regional locations with the same quarter sales volumes from the previous quarter, he completes two separate analyses: an analysis comparing ice cream flavor sales year, and an analysis comparing total sales in dollars, including mean, median, mode, and compare the result with the previous year's sales. The Stores worksheet in the same workbook contains sales by store for the current quarter in dollars rounded to the nearest thousand dollars. You need to calculate some basic statistics for store sales. In the same quarter of the previous year, these values were: standard deviation, of sales by store. Sales by Flavor in Gallons The first analysis, sales by flavor, compares the total quantities sold in gallons. The data collected provides for each flavor the number of pints, gallons, and 10-gallon tubs sold for all stores. Pints and gallons are sold directly to the public, whereas 10-gallon tubs are used for in-store sales of cones, cups, and specialty items such as sundaes and banana splits. To eliminate any impact of pricing changes or special promotions, Judd uses the ice cream volumes in gallons to compare sales by flavor. Judd has asked for your help this quarter in completing this analysis. He created two workbook files: Creme.xlsx, which contains the current quarter's sales on a worksheet named Flavors, and HCreme.xlsx, which contains the corresponding historical quarterly data for the previous year on a worksheet named HFlavors. For convenience, the flavors in both data sets are in identical order except for two new flavors introduced this appear at the bottom of the current data set. Keep in mind the following conversions when analyzing this data: year, which There are 8 pints per gallon. Each tub holds 10 gallons. Also, when calculating values for 10-gallon tubs, Judd has asked you to use the convention of rounding down the values to the nearest whole tub. Sales by Store in Dollars The second analysis you need to complete is to summarize sales in dollars by store and Mean: $8,817 Median: $8,000 . Mode: $5,500 Standard Deviation: $2,920 When writing formulas, be certain to use the most efficient method, including the use of 1. Open the workbook named Creme,xlsx located in the Chapter 2 folder, and then 2. On the Flavors worksheet, for the current quarter, calculate the total number of gallons sold for each favor. Place this calculation in the column adjacent to the data sion values. Remember to round down the tub quantities to the nearest whole tub provided. Above the list of flavors, in a separate area, list and clearly label the conver- 3. Add another column in which to enter the total number of gallons from last year. for last year from the HCreme.xlsx workbook in the Chapter 2 folder into the newly Copy the values for the total amount of ice cream sold for the corresponding flavor Solving Problems with Statistical Analysis Tools Chapter 2 functions as well as relative and absolute cell referencing Complete the following: save it as Creme Current Sales Analysis.xlsx when completing the calculation. added column of the Flavors worksheet. 4. Calculate the overall total and mean number of gallons sold for all flavors for this quarter and for this quarter last year. (Note: Include all flavors in your calculation, whether or not there are sales for them in a given year.) 5. Calculate for each flavor the percent of total gallons this flavor represents compared with total sales for the current quarter of all flavors. Copy this formula to the adjacent column to calculate the percent of total gallons this flavor represents compared with historical total sales. 6. In the two adjacent columns, calculate for each flavor and for the totals the difference and percent difference in sales. Assume a positive value represents an increase in sales. Flavors without sales in the previous year should be left blank. (These cells should be completely empty.) TROUBLESHOOTING: In order to complete this step successfully, pay atten- tion to the order of precedence rules when writing the formula. Percent difference is defined as the difference between the new value minus the old value divided by the old value, so specifying the order in which the operations must occur is critical. 7. Switch to the Stores worksheet. Calculate the total sales, mean, median, mode, and standard deviation for this data set. Label the cells so that they can be easily identified. 8. On the same worksheet, set up a table to analyze the change and percent change of cach of these statistical values as compared with the historical values. Based on the changes, explain on the worksheet (just below your analysis) whether the stores are doing better this year, and if sales in stores are more or less likely to vary from mean sales than they did last year