

Question: help and thank you very much Remember, the expected value of a probability distribution is a statistical measure of the average (mean) value circumstances. To
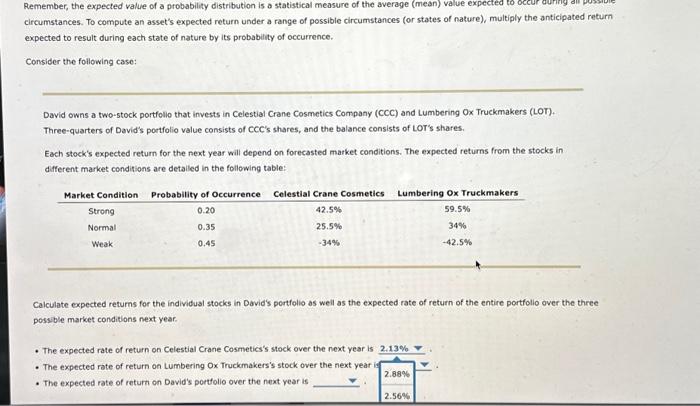
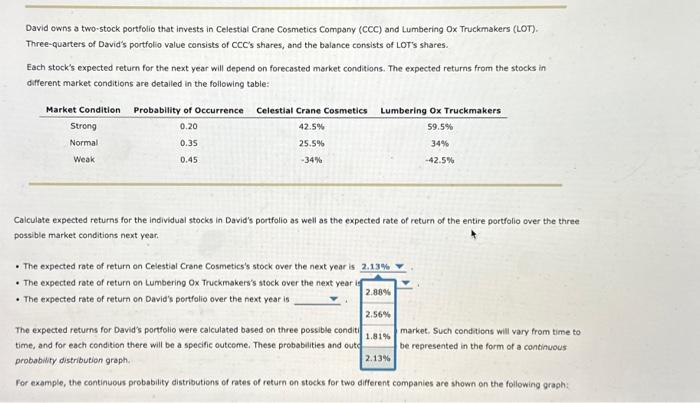
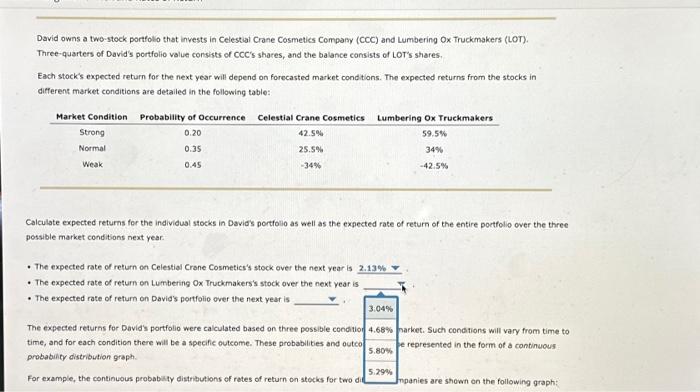
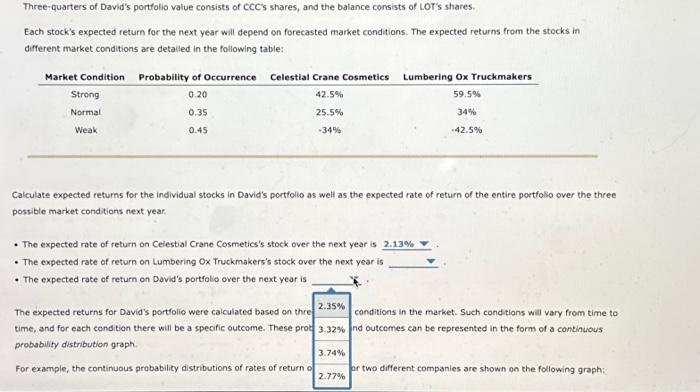
Remember, the expected value of a probability distribution is a statistical measure of the average (mean) value circumstances. To compute an asset's expected return under a range of possible circumstances (or states of nature), multiply the anticipated return expected to result during each state of nature by its probability of occurrence. Consider the following case: David owns a two-stock portfollo that invests in Celestial Crane Cosmetics Company (CCC) and Lumbering Ox Truckmakers (LOT). Three-quarters of David's portfolio value consists of CCC's shares, and the balance consists of LOT's shares. Each stock's expected return for the next year will depend on forecasted market conditions. The expected returns from the stocks in different market conditions are detalled in the following table: Calculate expected returns for the individual stocks in David's portfolio as well as the expected rate of return of the entire portfolio over the three possible market conditions next year. - The expected rate of return on Celestial Crane Cosmetics's stock over the next year is - The expected rate of return on Lumbering Ox Truckmakers's stock over the next year - The expected rate of return on David's portolio over the next year is David owns a two-stock portfolio that invests in Celestial Crane Cosmetics Company (CCC) and Lumbering Ox Truckmakers (LOT). Three-quarters of David's portfolio value consists of CCC's shares, and the balance consists of LOT's shares. Each stock's expected return for the next year will depend on forecasted market conditions. The expected returns from the stocks in different market conditions are detailed in the following table: Calculate expected returns for the individual stocks in David's portfolio as well as the expected rate of return of the entire portfolio over the three possible market conditions next year. - The expected rate of return on Celestial Crane Cosmetics's stock over the next year is - The expected rate of return on Lumbering Ox Truckmakers's stock over the next year is - The expected rate of return on David's portfolio over the next year is The expected returns for David's portfolio were calculated based on three possible conditi time, and for each condition there will be a specific outceme. These probabilities and outo probabity distribution greph. For example, the continuous probability distributions of rates of return on stocks for two different companies are shown on the following graph: David owns a two-stock portfolo that invests in Celestial Crone Cosmetics Company (CCC) and Lumbering Ox.Truckmakers (LOT). Three-quarters of David's pertfolio value consists of CCC's shares, and the balance consists of LOT's shares. Each stock's expected return for the next year will depend on forecasted market conditions. The expected returns from the stocks in different market conditions are detailed in the following tabie: Calculate expected returns for the individual stocks in Davides portfolio as well as the expected rate of return of the entire portfolio over the three possible market conditions next year: - The expected rate of return on Celestial Crane Cosmetics's stock over the next year is - The expected rate of return on Lumbering Ox Truckmakers's stock over the next year is - The expected rate of return on David's portfolio over the next year is The expected returns for David's portfolio were calculated based on three possible condtion time, and for each condition there will be a specific outcome. These probabilities and outco probability distribution graph. For example, the continuous probabiaty distributions of rates of return on stocks for two di Three-quarters of David's portfolio value consists of CCC's shares, and the balance corisists of LOT's shares. Each stock's expected return for the next year will depend on forecasted market conditions. The expected returns from the stocks in different market conditions are detalled in the following table: Calculate expected returns for the individual stocks in David's portfolio as well as the expected rate of return of the entire portfolio over the three possible market conditions next year. - The expected rate of return on Celestial Crane Cosmetics's stock over the next year is - The expected rate of return on Lumbering Ox Truckmakers's stock over the next year is - The expected rate of return on David's portfolio over the next year is The expected returns for David's portfolio were calculated based on thre 2.35% time, and for each condition there will be a specic outcome. These prot probability distribution graph. For example, the continuous probability distributions of rates of return o 3.32% 3.74% 2.77% conditions in the market. Such conditions will vary from time to nd outcomes can be represented in the form of a contiauous. or two different companies are shown on the following graph
Step by Step Solution
There are 3 Steps involved in it

Get step-by-step solutions from verified subject matter experts