

Question: Help answering question 8. Please! 8. The CFO would also like you to prepare some data visualizations that depict monthly trends in the cash balance,
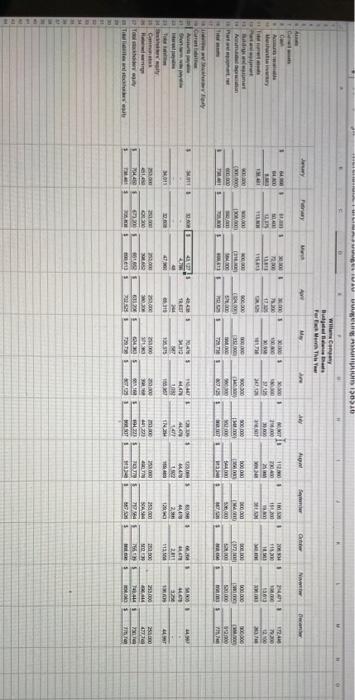
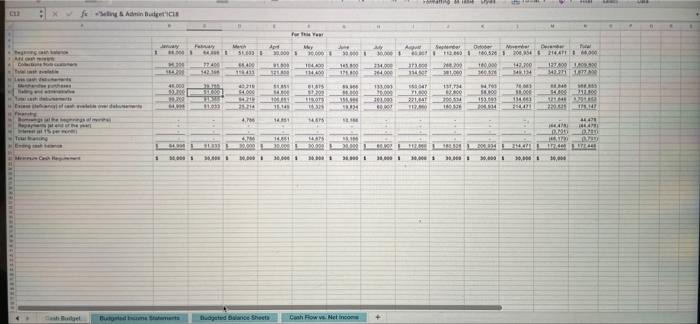
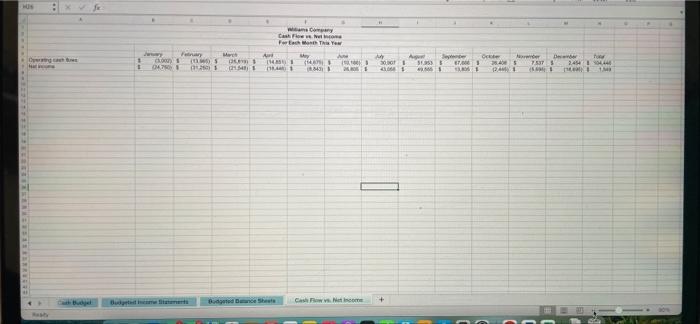
8. The CFO would also like you to prepare some data visualizations that depict monthly trends in the cash balance, current assets, and net income. Accordingly, use Charts to do the following: a. Go to the "Cash Budget" tab and create a bar chart that includes a one bar for each of 12 months. Each month's bar will show the excess (deficiency) of cash available over disbursements for that month and (where appropriate) the borrowings for that month. Use different colors to distinguish the excess (deficiency) of cash available over disbursements from any borrowings. Also, insert a horizontal line within your chart to depict the company's minimum cash balance of $30,000. b. Go to the BudgetedBalance Sheets" tab and create a bar chart that depicts each month's ending total current assets. Each bar within the chart will sub-divide into three parts-the portion of the overall balance that resides in cash, accounts receivable, and inventory. c. Go to the "Cash Flow vs. Net Income" tab and create a line chart that includes a total of two lines. The first line will depict monthly trends in operating cash flows (cash collections from customers minus total cash disbursements, including interest payments) and the second line will depict net income. d. What insights are revealed by the charts in requirements 8a, 8b, and 8c? U STIU 150ib wilay For M TINY A Aga Q NI A 0 4 12 Am HA I. 15 22,00 12 AN 190.000 20301 MO BE an 11 W RE 17 EM NIK wa w BOOK KO Bad min w B000 00000 RE ME 000 10 COM 000 W WE 53000 mu W 1 CH Ar 1 1 WA 4248 TRT 10485 US ALON $ 27 3 AN UN NY 12 444 2 1 2011 44.0 27 NO 1 G HEN I 300 25 2001 25130 WOOR w 201 200 471 NI DIR 1 YO ME CE Tools TH WE 5 T 1 5 HEN $ 5 DO fely in Budget - - Apr 2005 A Se Tuw wy 70.000 0000 IONLIM 14,411 COM 214 224 42100 1000 w BE RED NE HER 118 IN 7805203 2005 142.00 SEX ME 18.00 LE 48.000 9 15, IN SI 140 20 133.000 10.00 00 2 BE LE HE 221.4 11 034 14 US 4. 1465 4 1418 HU Tui WTS BRIM LLL 11 30 FEE 11.12 ALTELE 10.00 1 1 . 1900 30.01 10 18.00 . 30.000 tagatud net Cash Row Net income US fe wine Cashew Foto The O De OS 114 AR . 2.0 ST 2494 1 07 011 HIS ww w ww 1 1 I Casco + 8. The CFO would also like you to prepare some data visualizations that depict monthly trends in the cash balance, current assets, and net income. Accordingly, use Charts to do the following: a. Go to the "Cash Budget" tab and create a bar chart that includes a one bar for each of 12 months. Each month's bar will show the excess (deficiency) of cash available over disbursements for that month and (where appropriate) the borrowings for that month. Use different colors to distinguish the excess (deficiency) of cash available over disbursements from any borrowings. Also, insert a horizontal line within your chart to depict the company's minimum cash balance of $30,000. b. Go to the BudgetedBalance Sheets" tab and create a bar chart that depicts each month's ending total current assets. Each bar within the chart will sub-divide into three parts-the portion of the overall balance that resides in cash, accounts receivable, and inventory. c. Go to the "Cash Flow vs. Net Income" tab and create a line chart that includes a total of two lines. The first line will depict monthly trends in operating cash flows (cash collections from customers minus total cash disbursements, including interest payments) and the second line will depict net income. d. What insights are revealed by the charts in requirements 8a, 8b, and 8c? U STIU 150ib wilay For M TINY A Aga Q NI A 0 4 12 Am HA I. 15 22,00 12 AN 190.000 20301 MO BE an 11 W RE 17 EM NIK wa w BOOK KO Bad min w B000 00000 RE ME 000 10 COM 000 W WE 53000 mu W 1 CH Ar 1 1 WA 4248 TRT 10485 US ALON $ 27 3 AN UN NY 12 444 2 1 2011 44.0 27 NO 1 G HEN I 300 25 2001 25130 WOOR w 201 200 471 NI DIR 1 YO ME CE Tools TH WE 5 T 1 5 HEN $ 5 DO fely in Budget - - Apr 2005 A Se Tuw wy 70.000 0000 IONLIM 14,411 COM 214 224 42100 1000 w BE RED NE HER 118 IN 7805203 2005 142.00 SEX ME 18.00 LE 48.000 9 15, IN SI 140 20 133.000 10.00 00 2 BE LE HE 221.4 11 034 14 US 4. 1465 4 1418 HU Tui WTS BRIM LLL 11 30 FEE 11.12 ALTELE 10.00 1 1 . 1900 30.01 10 18.00 . 30.000 tagatud net Cash Row Net income US fe wine Cashew Foto The O De OS 114 AR . 2.0 ST 2494 1 07 011 HIS ww w ww 1 1 I Casco +
Step by Step Solution
There are 3 Steps involved in it

Get step-by-step solutions from verified subject matter experts