

Question: help asap Complete the steps below using cell references to given data or previous calculations. In some cases, a simple cell reference is all you
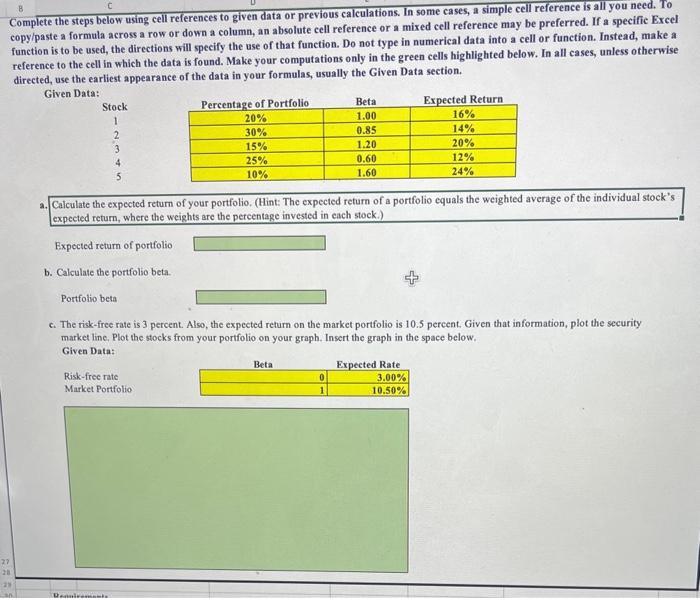
Complete the steps below using cell references to given data or previous calculations. In some cases, a simple cell reference is all you need. Io copy/paste a formula across a row or down a column, an absolute cell reference or a mixed cell reference may be preferred. If a specific Excel function is to be used, the directions will specify the use of that function. Do not type in numerical data into a cell or function. Instead, make a reference to the cell in which the data is found. Make your computations only in the green cells highlighted below. In all cases, unless otherwise directed, use the earliest appearance of the data in your formulas, usually the Given Data section. Given Data: Stock 1 2 3 4 5 a. Calculate the expected retum of your portfolio. (Hint: The expected return of a portfolio equals the weighted average of the individual stock's expected return, where the weights are the percentage invested in each stock.) Expected return of portfolio b. Calculate the portfolio beta. Portfolio beta c. The risk-free rate is 3 percent. Also, the expected return on the market portfolio is 10.5 percent. Given that information, plot the security market line. Plot the stocks from your portfolio on your graph. Insert the graph in the space below
Step by Step Solution
There are 3 Steps involved in it

Get step-by-step solutions from verified subject matter experts