

Question: help ASAP PLEASE ASAP Problem 3. Several series of data on pressure drops (P) vs flow rates (Q) were plotted on a log-log graph paper,
help ASAP PLEASE ASAP
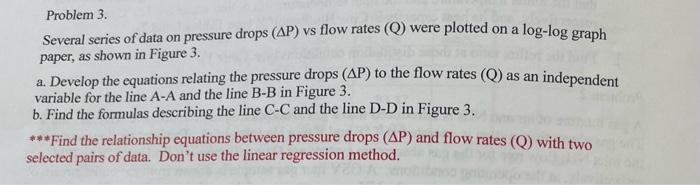
Problem 3. Several series of data on pressure drops (P) vs flow rates (Q) were plotted on a log-log graph paper, as shown in Figure 3. a. Develop the equations relating the pressure drops (P) to the flow rates (Q) as an independent variable for the line AA and the line BB in Figure 3 . b. Find the formulas describing the line CC and the line D-D in Figure 3. ***Find the relationship equations between pressure drops (P) and flow rates (Q) with two selected pairs of data. Don't use the linear regression method
Step by Step Solution
There are 3 Steps involved in it
1 Expert Approved Answer
Step: 1 Unlock

Question Has Been Solved by an Expert!
Get step-by-step solutions from verified subject matter experts
Step: 2 Unlock
Step: 3 Unlock