Question: help Homework: Homework 4 (Chapter 6 Supplement) Question 7, Problem 65.6 Part 2 of 6 HW Score: 38.24%, 13 of 34 points O Points: 0

help help Homework: Homework 4 (Chapter 6 Supplement)
Homework: Homework 4 (Chapter 6 Supplement) Question 7, Problem 65.6 Part 2 of 6 HW Score: 38.24%, 13 of 34 points O Points: 0 of 6 Save Refer to Table 96.1 . Factors for Computing Control Chart Limits (3 sigma) for this problem. Sampling 4 pieces of precision-cut wire (to be used in computer assembly) every hour for the past 24 hours has produced the following results: Hour X 1 3.35 2 3.20 3 3.32 4 3.39 5 3.17 6 2.86 R 0.76" 1.18 1.43 1.21 1.12 0.37 Hour 7 8 9 10 11 12 * R 3.15" 0.48 2.75 1.13 3.02 0.66 2.75 1.28 2.73 1.12 2.97 0.35 Hour 13 14 15 16 17 18 X R 3.11" 0.80" 2.93 1.31 3.12 1.06 2.94 0.50 2.96 1.38 2.74 1.34 Hour 19 20 21 22 23 24 x 3.31" 2.79 2.65 3.38 2.84 2.64 R 1.56" 1.09 1.13 0.41 1.58 0.92 Based on the sampling done, the control limits for 3-sigma x chart are (round all intermediate calculations to three decimal places before proceeding with further calculations): Upper Control Limit (UCL) = 3.740 inches (round your response to three decimal places). Lower Control Limit (LCL) - inches (round your response to three decimal places)

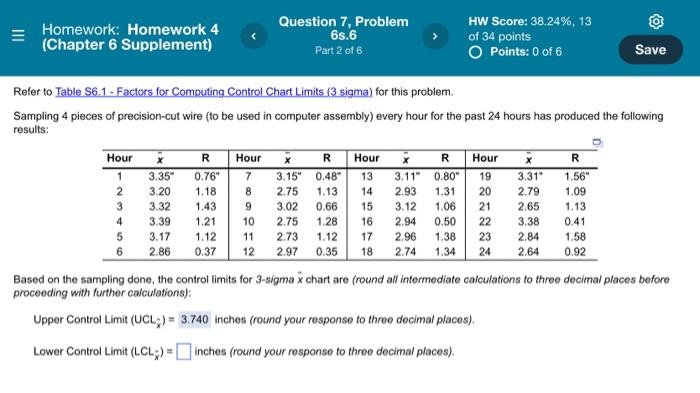
Step by Step Solution

There are 3 Steps involved in it

1 Expert Approved Answer
Step: 1 Unlock blur-text-image
Question Has Been Solved by an Expert!

Get step-by-step solutions from verified subject matter experts

Step: 2 Unlock
Step: 3 Unlock

Students Have Also Explored These Related General Management Questions!