

Question: need help finding the upper and lower control limits for x and r Homework: Chapter 6s Homework Question 7, Problem 68.10 Part 2 of 7
need help finding the upper and lower control limits for x and r
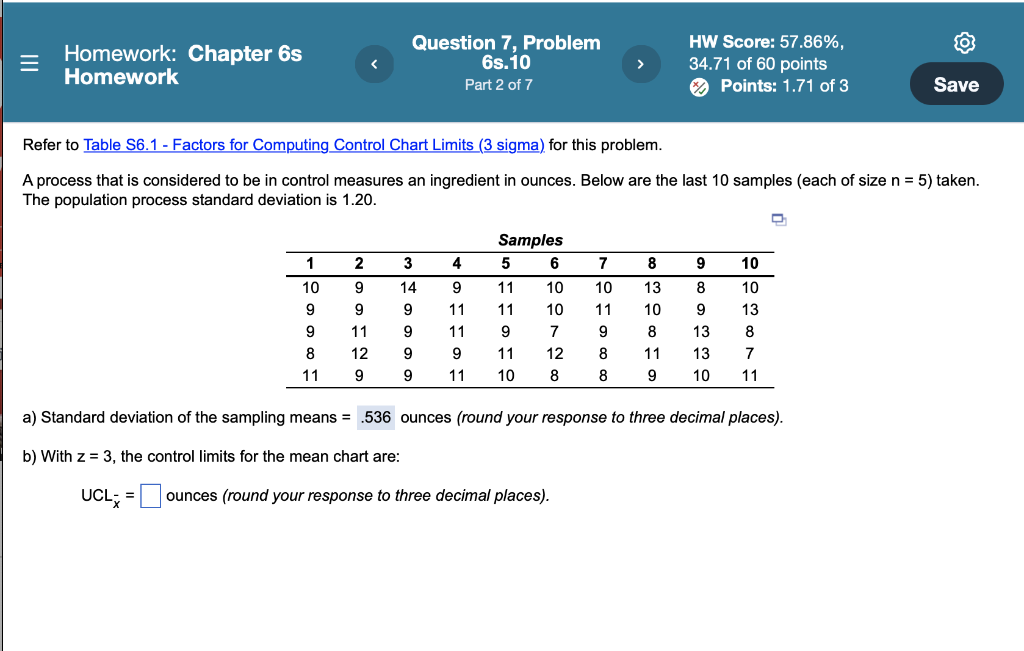
Homework: Chapter 6s Homework Question 7, Problem 68.10 Part 2 of 7 HW Score: 57.86%, 34.71 of 60 points Points: 1.71 of 3 Save Refer to Table 56.1 - Factors for Computing Control Chart Limits (3 sigma) for this problem. A process that is considered to be in control measures an ingredient in ounces. Below are the last 10 samples (each of size n = 5) taken. The population process standard deviation is 1.20. Samples 5 6 2 3 4 8 9 10 1 10 9 14 11 7 10 11 10 9 9 11 13 9 9 10 10 7 12 9 9 11 11 9 11 11 9 9 13 10 8 11 9 8 9 13 13 10 8 11 8 8 11 12 9 9 9 7 11 10 8 8 a) Standard deviation of the sampling means = .536 ounces (round your response to three decimal places). b) With z = 3, the control limits for the mean chart are: UCL; -ounces (round your response to three decimal places)Step by Step Solution
There are 3 Steps involved in it
1 Expert Approved Answer
Step: 1 Unlock

Question Has Been Solved by an Expert!
Get step-by-step solutions from verified subject matter experts
Step: 2 Unlock
Step: 3 Unlock