Question: HELP! How to solve this project. PROJECT 1: USING THE AMPS MODEL TO ADDRESS THE QUESTION OF LOAN REPAYMENT Lending Club is a U.S.-based peer-to-peer
HELP! How to solve this project.
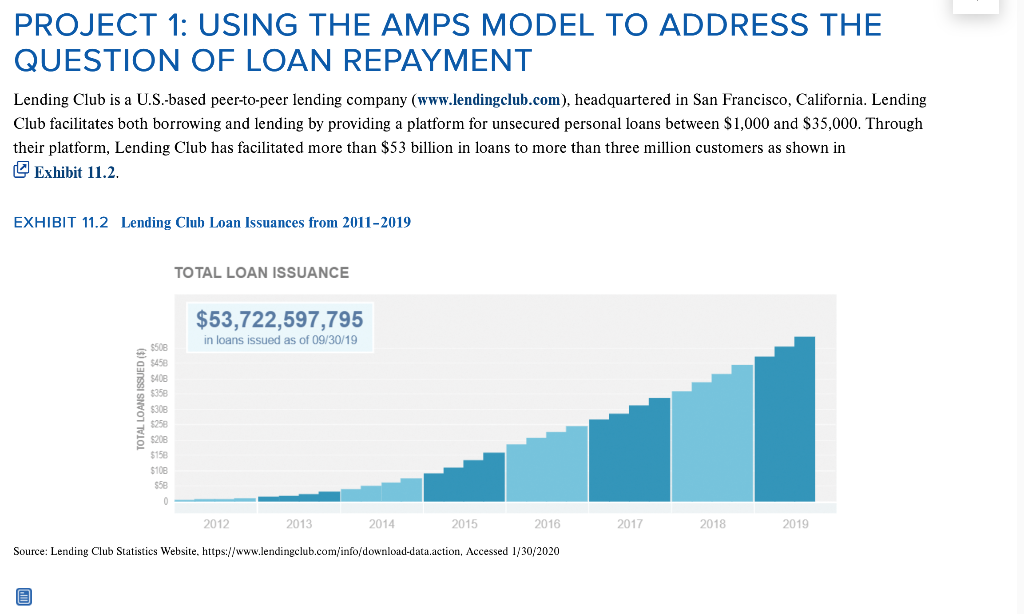
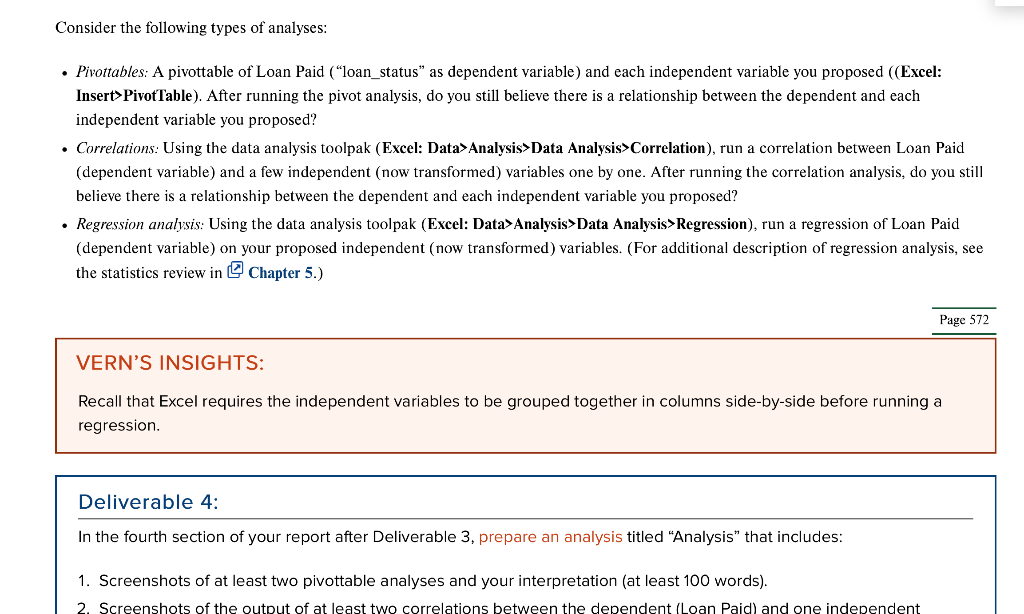
PROJECT 1: USING THE AMPS MODEL TO ADDRESS THE QUESTION OF LOAN REPAYMENT Lending Club is a U.S.-based peer-to-peer lending company (www.lendingclub.com), headquartered in San Francisco, California. Lending Club facilitates both borrowing and lending by providing a platform for unsecured personal loans between $1,000 and $35,000. Through their platform, Lending Club has facilitated more than $53 billion in loans to more than three million customers as shown in Exhibit 11.2. EXHIBIT 11.2 Lending Club Loan Issuances from 2011-2019 TOTAL LOAN ISSUANCE $53,722,597,795 in loans issued as of 09/30/19 TOTAL LOANS ISSUED ($) 5508 $450 $408 5358 5308 5258 5208 $150 $108 $58 2012 2013 2014 2015 2016 2017 2018 2019 Source: Lending Club Statistics Website, https://www.lendingclub.com/info/download-data.action, Accessed 1/30/2020 provided by your instructor. Lending Club provides a summary dataset of the loans extended to borrowers since 2007. Step 1 Download the file named "LoanStats 3a.csv" from Connect, which covers the loan data from 2007 - 2011. One reason we use data that is so "old" in our analysis is that the loan repayment will be either completed or it will be charged off (not repaid) by today's date. We don't have to wait for time to pass to see the ultimate resolution of the loan repayment. Open the file named "LoanStats3a.csv" in Excel and look at the data. Each row represents a different loan. Each column represents an attribute of the loan or of the borrower of that loan. For example, Column D-funded_amnt"-lists the amount of each loan that was funded. Dependent Variables In column Q, titled "loan_status," there are two possible entries, "Charged Off" or "Fully Paid." This is the dependent variable we are examining. Later in the analysis, we will transform this variable into Loan Paid," which will then serve as our primary dependent variable. Page 570 Potential Independent or Explanatory Variables The first step in determining the best data for use is to consider the various explanatory, or independent, variables. That is, which variables are most likely to explain whether the loan was repaid or not? In this case, you may want to examine how much debt the borrower already has or how much income he or she has available to pay back loans, etc. For example, loan repayment might be determined by whether a borrower owns her home, rents her home, or still has a mortgage from the information contained in Column M, labeled "home_ownership." Perhaps length of employment matters ("emp_length in Column L) or amount of annual income ("annual_inc" in Column N) will help determine repayment. Perhaps the debt-to-income ratio might determine if the borrowers (dti in Column Y) will be able to repay the loan. Length of loan ("term", Column F), whether the income is verified (verification_status, Column O), or state where they live ("addr_state" in Column X) are also possible independent variables. As the data analyst on this project, it is your job to find potential independent variables that may help explain loan repayment. Deliverable 1: Once you have found all variables that may explain loan repayment, prepare a document (in Microsoft Word), and save it as "Project 1: Lending Club Loan Analysis First Name and Last Name" (inserting your first and last name). Title the first section of the document Dependent and Independent Variables". Next, within the document, identify and type the names of the dependent variable and at least five proposed independent variables that you think explain loan repayment. Step 2 After determining the variables to use in the analysis, make sure the data is as follows. 1. Make sure that data is not missing. Check the dataset to make sure that all variables are complete and are not missing data. Hint: Run the COUNT() function in Excel to see if the count of each variable equals the count of loans in the dataset, etc. 2. Make sure there are no errors in the data. Using the data analysis toolpak (Excel: Data>>Analysis>Data Analysis>Descriptive Statistics), run a descriptive analysis for your proposed independent and dependent variables looking at the minimums, maximums, and averages (see Chapter 6) or generate a histogram to identify unusual outliers or anomalies (see Chapter 7) to assess whether there are any errors. Deliverable 2: In the second section of your report (after Deliverable 1), prepare a descriptive analysis titled "Descriptives" that includes a screenshot of descriptive statistics for all the proposed dependent and independent variables. Using the data analysis toolpak, predict how the independent variables might relate to the loan repayment. For example, we would predict a negative relationship between "dti" (the debt-to-income ratio) and loan repayment because the more debt you have, the less likely you'll be able to repay a loan. Page 571 3. Transform the non-numeric data into numeric data. Unless the analysis is done exclusively using categorical data, transform the data into a numeric variable. Following are examples of how to transform four of the variables: Loan Status: This is the variable we're using as our dependent variable, but currently it is non-numeric data. Let's make a new variable titled "Loan Paid" with the value of 1 if the "loan_status" (in Column Q) is Fully Paid" and a value of 0 if the "loan_status" is "Charged Off." After this point in the analysis, only this variable will be used as the dependent variable, instead of "loan_status." Employment Length: It would appear that the "emp_length in Column L might be useful in the analysis as a number (number of years of employment), but it is presently a non-numeric with values including 3 years" and "10+ years." So you could transform the 10+ years" variable to have a numeric value of 10," transform"PivotTable). After running the pivot analysis, do you still believe there is a relationship between the dependent and each independent variable you proposed? Correlations: Using the data analysis toolpak (Excel: Data Analysis>Data Analysis Correlation), run a correlation between Loan Paid (dependent variable) and a few independent (now transformed) variables one by one. After running the correlation analysis, do you still believe there is a relationship between the dependent and each independent variable you proposed? Regression analysis: Using the data analysis toolpak (Excel: Data Analysis>Data Analysis>Regression), run a regression of Loan Paid (dependent variable) on your proposed independent (now transformed) variables. (For additional description of regression analysis, see the statistics review in Chapter 5.) Page 572 VERN'S INSIGHTS: Recall that Excel requires the independent variables to be grouped together in columns side-by-side before running a regression. Deliverable 4: In the fourth section of your report after Deliverable 3, prepare an analysis titled "Analysis" that includes: 1. Screenshots of at least two pivottable analyses and your interpretation (at least 100 words). 2. Screenshots of the output of at least two correlations between the dependent (Loan Paid) and one independent a. What is your interpretation of the findings? Hint: In general, if the t-statistic is greater than 2, it is likely a significant variable in predicting loan repayment. b. Was the relationship in the direction (positive vs. negative vs. no relationship) different than you anticipated in Deliverable 2? Share the Story Based on the analysis, consider how to present your findings explaining loan repayment to Lending Club management. Would you use graphs, reports, correlations, pivottables, or regression results to share the story? How would you most effectively communicate the findings? Deliverable 5: In the fifth section of your report after Deliverable 4, prepare an analysis titled "Final Report" that includes: 1. An executive summary that is a maximum of one page. This should concisely describe the recommended course of action and the main support for your recommendation. 2. A report summarizing your findings and any graphs, reports, correlations, pivottables, or regression results to best communicate the findings. 3. A brief discussion of how these findings might help predict loan repayment in the future even before a loan is extended. PROJECT 1: USING THE AMPS MODEL TO ADDRESS THE QUESTION OF LOAN REPAYMENT Lending Club is a U.S.-based peer-to-peer lending company (www.lendingclub.com), headquartered in San Francisco, California. Lending Club facilitates both borrowing and lending by providing a platform for unsecured personal loans between $1,000 and $35,000. Through their platform, Lending Club has facilitated more than $53 billion in loans to more than three million customers as shown in Exhibit 11.2. EXHIBIT 11.2 Lending Club Loan Issuances from 2011-2019 TOTAL LOAN ISSUANCE $53,722,597,795 in loans issued as of 09/30/19 TOTAL LOANS ISSUED ($) 5508 $450 $408 5358 5308 5258 5208 $150 $108 $58 2012 2013 2014 2015 2016 2017 2018 2019 Source: Lending Club Statistics Website, https://www.lendingclub.com/info/download-data.action, Accessed 1/30/2020 provided by your instructor. Lending Club provides a summary dataset of the loans extended to borrowers since 2007. Step 1 Download the file named "LoanStats 3a.csv" from Connect, which covers the loan data from 2007 - 2011. One reason we use data that is so "old" in our analysis is that the loan repayment will be either completed or it will be charged off (not repaid) by today's date. We don't have to wait for time to pass to see the ultimate resolution of the loan repayment. Open the file named "LoanStats3a.csv" in Excel and look at the data. Each row represents a different loan. Each column represents an attribute of the loan or of the borrower of that loan. For example, Column D-funded_amnt"-lists the amount of each loan that was funded. Dependent Variables In column Q, titled "loan_status," there are two possible entries, "Charged Off" or "Fully Paid." This is the dependent variable we are examining. Later in the analysis, we will transform this variable into Loan Paid," which will then serve as our primary dependent variable. Page 570 Potential Independent or Explanatory Variables The first step in determining the best data for use is to consider the various explanatory, or independent, variables. That is, which variables are most likely to explain whether the loan was repaid or not? In this case, you may want to examine how much debt the borrower already has or how much income he or she has available to pay back loans, etc. For example, loan repayment might be determined by whether a borrower owns her home, rents her home, or still has a mortgage from the information contained in Column M, labeled "home_ownership." Perhaps length of employment matters ("emp_length in Column L) or amount of annual income ("annual_inc" in Column N) will help determine repayment. Perhaps the debt-to-income ratio might determine if the borrowers (dti in Column Y) will be able to repay the loan. Length of loan ("term", Column F), whether the income is verified (verification_status, Column O), or state where they live ("addr_state" in Column X) are also possible independent variables. As the data analyst on this project, it is your job to find potential independent variables that may help explain loan repayment. Deliverable 1: Once you have found all variables that may explain loan repayment, prepare a document (in Microsoft Word), and save it as "Project 1: Lending Club Loan Analysis First Name and Last Name" (inserting your first and last name). Title the first section of the document Dependent and Independent Variables". Next, within the document, identify and type the names of the dependent variable and at least five proposed independent variables that you think explain loan repayment. Step 2 After determining the variables to use in the analysis, make sure the data is as follows. 1. Make sure that data is not missing. Check the dataset to make sure that all variables are complete and are not missing data. Hint: Run the COUNT() function in Excel to see if the count of each variable equals the count of loans in the dataset, etc. 2. Make sure there are no errors in the data. Using the data analysis toolpak (Excel: Data>>Analysis>Data Analysis>Descriptive Statistics), run a descriptive analysis for your proposed independent and dependent variables looking at the minimums, maximums, and averages (see Chapter 6) or generate a histogram to identify unusual outliers or anomalies (see Chapter 7) to assess whether there are any errors. Deliverable 2: In the second section of your report (after Deliverable 1), prepare a descriptive analysis titled "Descriptives" that includes a screenshot of descriptive statistics for all the proposed dependent and independent variables. Using the data analysis toolpak, predict how the independent variables might relate to the loan repayment. For example, we would predict a negative relationship between "dti" (the debt-to-income ratio) and loan repayment because the more debt you have, the less likely you'll be able to repay a loan. Page 571 3. Transform the non-numeric data into numeric data. Unless the analysis is done exclusively using categorical data, transform the data into a numeric variable. Following are examples of how to transform four of the variables: Loan Status: This is the variable we're using as our dependent variable, but currently it is non-numeric data. Let's make a new variable titled "Loan Paid" with the value of 1 if the "loan_status" (in Column Q) is Fully Paid" and a value of 0 if the "loan_status" is "Charged Off." After this point in the analysis, only this variable will be used as the dependent variable, instead of "loan_status." Employment Length: It would appear that the "emp_length in Column L might be useful in the analysis as a number (number of years of employment), but it is presently a non-numeric with values including 3 years" and "10+ years." So you could transform the 10+ years" variable to have a numeric value of 10," transform"PivotTable). After running the pivot analysis, do you still believe there is a relationship between the dependent and each independent variable you proposed? Correlations: Using the data analysis toolpak (Excel: Data Analysis>Data Analysis Correlation), run a correlation between Loan Paid (dependent variable) and a few independent (now transformed) variables one by one. After running the correlation analysis, do you still believe there is a relationship between the dependent and each independent variable you proposed? Regression analysis: Using the data analysis toolpak (Excel: Data Analysis>Data Analysis>Regression), run a regression of Loan Paid (dependent variable) on your proposed independent (now transformed) variables. (For additional description of regression analysis, see the statistics review in Chapter 5.) Page 572 VERN'S INSIGHTS: Recall that Excel requires the independent variables to be grouped together in columns side-by-side before running a regression. Deliverable 4: In the fourth section of your report after Deliverable 3, prepare an analysis titled "Analysis" that includes: 1. Screenshots of at least two pivottable analyses and your interpretation (at least 100 words). 2. Screenshots of the output of at least two correlations between the dependent (Loan Paid) and one independent a. What is your interpretation of the findings? Hint: In general, if the t-statistic is greater than 2, it is likely a significant variable in predicting loan repayment. b. Was the relationship in the direction (positive vs. negative vs. no relationship) different than you anticipated in Deliverable 2? Share the Story Based on the analysis, consider how to present your findings explaining loan repayment to Lending Club management. Would you use graphs, reports, correlations, pivottables, or regression results to share the story? How would you most effectively communicate the findings? Deliverable 5: In the fifth section of your report after Deliverable 4, prepare an analysis titled "Final Report" that includes: 1. An executive summary that is a maximum of one page. This should concisely describe the recommended course of action and the main support for your recommendation. 2. A report summarizing your findings and any graphs, reports, correlations, pivottables, or regression results to best communicate the findings. 3. A brief discussion of how these findings might help predict loan repayment in the future even before a loan is extended


