

Question: Help! I have been stuck on this lab for hours! WORKSHEET 1 Descriptive Statistics: n=1, n=5, n=10, n=30, n=100 Statistics Variable N N* Mean SE
Help! I have been stuck on this lab for hours!
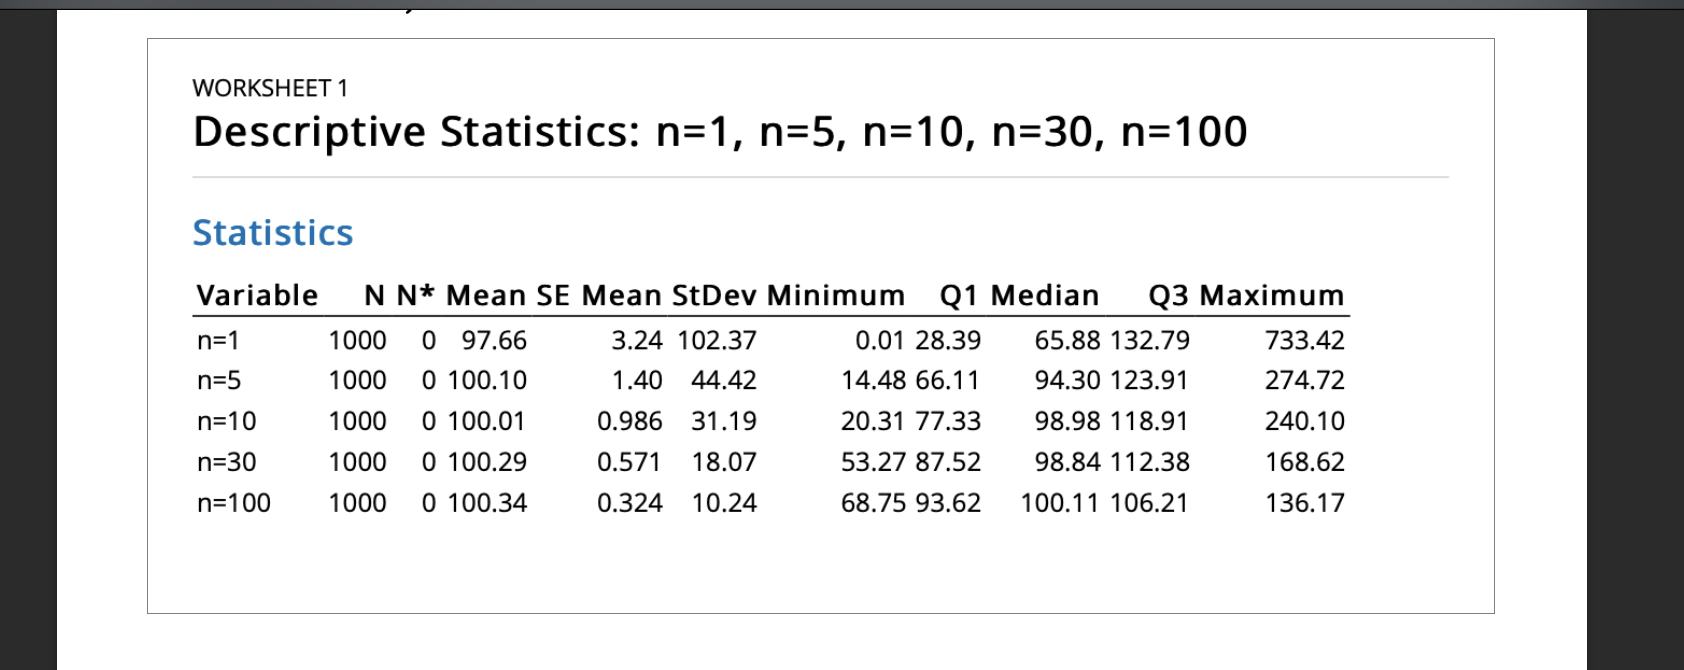
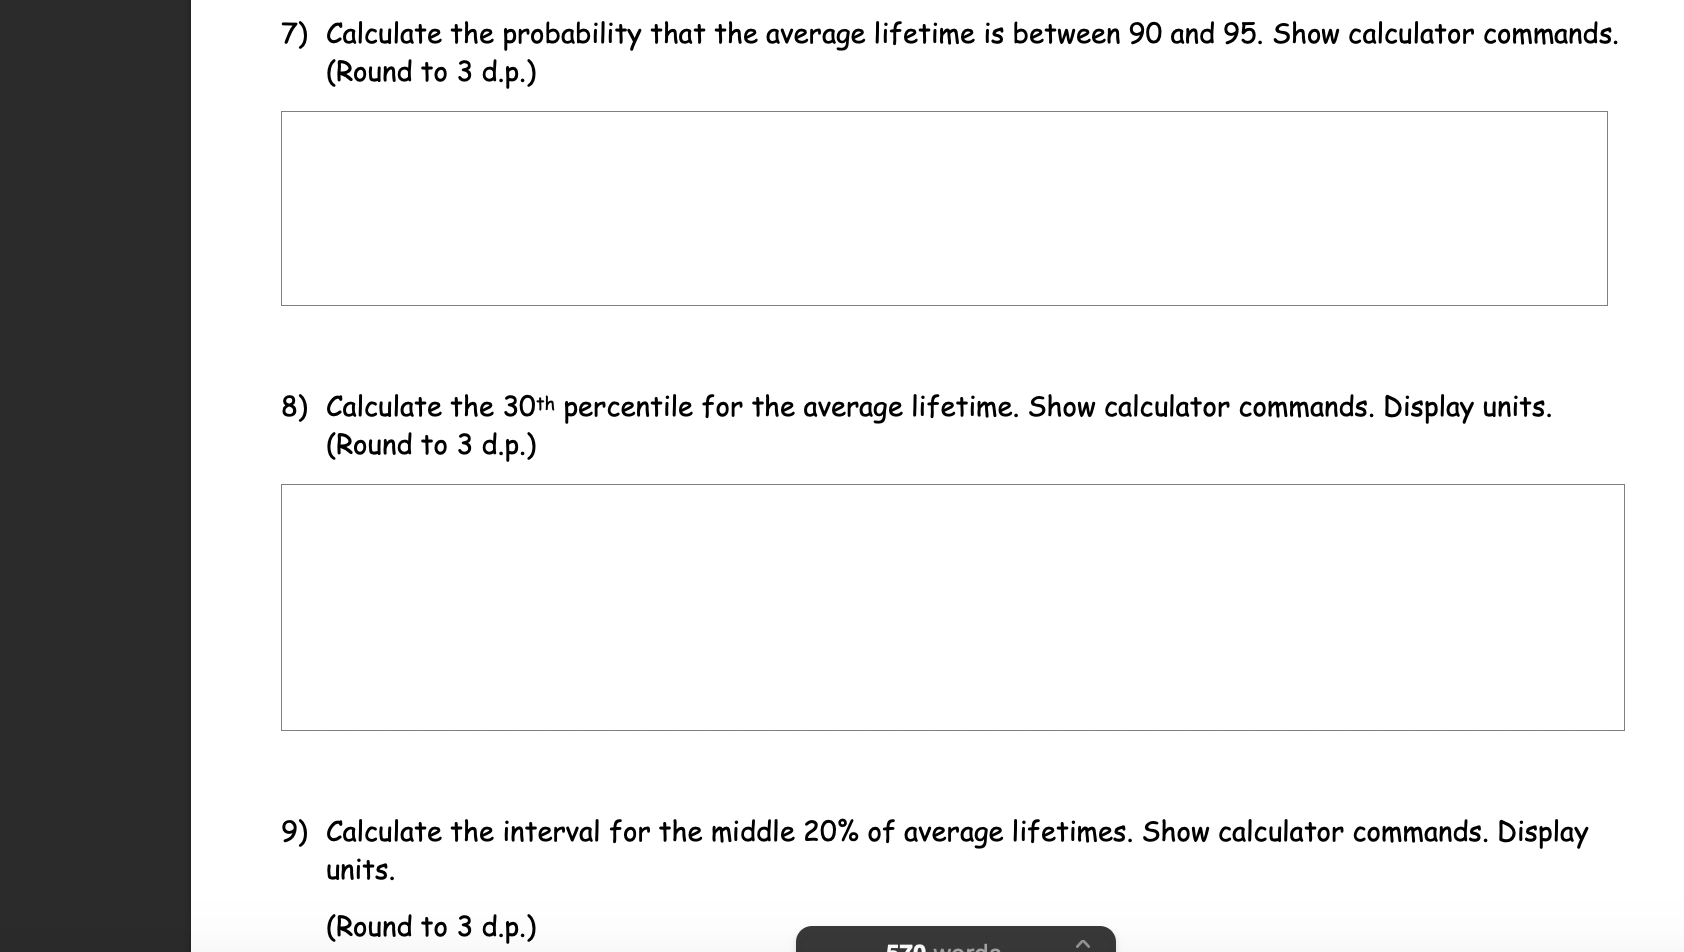
WORKSHEET 1 Descriptive Statistics: n=1, n=5, n=10, n=30, n=100 Statistics Variable N N* Mean SE Mean StDev Minimum Q1 Median Q3 Maximum n=1 1000 0 97.66 3.24 102.37 0.01 28.39 65.88 132.79 733.42 n=5 1000 0 100.10 1.40 44.42 14.48 66.11 94.30 123.91 274.72 n=10 1000 0 100.01 0.986 31.19 20.31 77.33 98.98 118.91 240.10 n=30 1000 0 100.29 0.571 18.07 53.27 87.52 98.84 112.38 168.62 n=100 1000 0 100.34 0.324 10.24 68.75 93.62 100.11 106.21 136.177) Calculate the probability that the average lifetime is between 90 and 95. Show calculator commands. (Round to 3 do.) 8) Calculate the 30th percentile for the average lifetime. Show calculator commands. Display units. (Round to 3 do.) 9) Calculate the interval for the middle 20% of average lifetimes. Show calculator commands. Display units. (Md * 3 \"W -_
Step by Step Solution
There are 3 Steps involved in it

Get step-by-step solutions from verified subject matter experts