

Question: HELP! I've been working on this question for the past hour ans cant seem to get it right! Taxable income and Total Tax Liability are
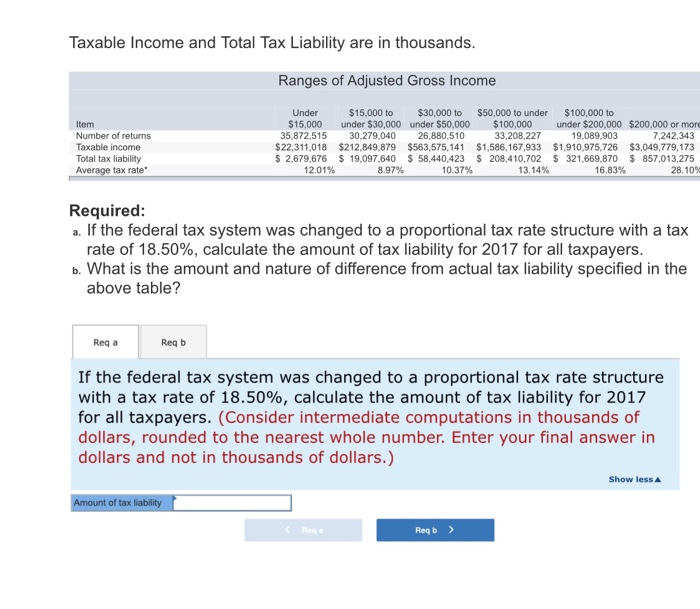
Taxable income and Total Tax Liability are in thousands. Ranges of Adjusted Gross Income Item Number of returns Taxable income Total tax liability Average tax rate Under $15,000 35,872,515 $22,311,018 $ 2,679,676 12.01% $15,000 to $30,000 to under $30,000 under $50,000 30,279,040 26,880,510 $212,849,879 $563,575,141 $ 19.097,640 $ 58,440,423 8979 10.37% $50,000 to under $100,000 33,208,227 $1,586,167,933 S 208,410,702 13.14% $100,000 to under $200,000 $200,000 or more 19.089,903 7.242,343 $1,910,975,726 $3,049,779,173 $ 321,669,870 $ 857,013,275 16.83% 28.10% Required: a. If the federal tax system was changed to a proportional tax rate structure with a tax rate of 18.50%, calculate the amount of tax liability for 2017 for all taxpayers. b. What is the amount and nature of difference from actual tax liability specified in the above table? Reqa Reqb If the federal tax system was changed to a proportional tax rate structure with a tax rate of 18.50%, calculate the amount of tax liability for 2017 for all taxpayers. (Consider intermediate computations in thousands of dollars, rounded to the nearest whole number. Enter your final answer in dollars and not in thousands of dollars.) Show less Amount of tax liability - Roga - Reqb >
Step by Step Solution
There are 3 Steps involved in it

Get step-by-step solutions from verified subject matter experts