

Question: HELP Lesson 6 Relations and Functions Final Review Assignment 2. The graph shown gives the height of the tide in a harbour as a function
HELP
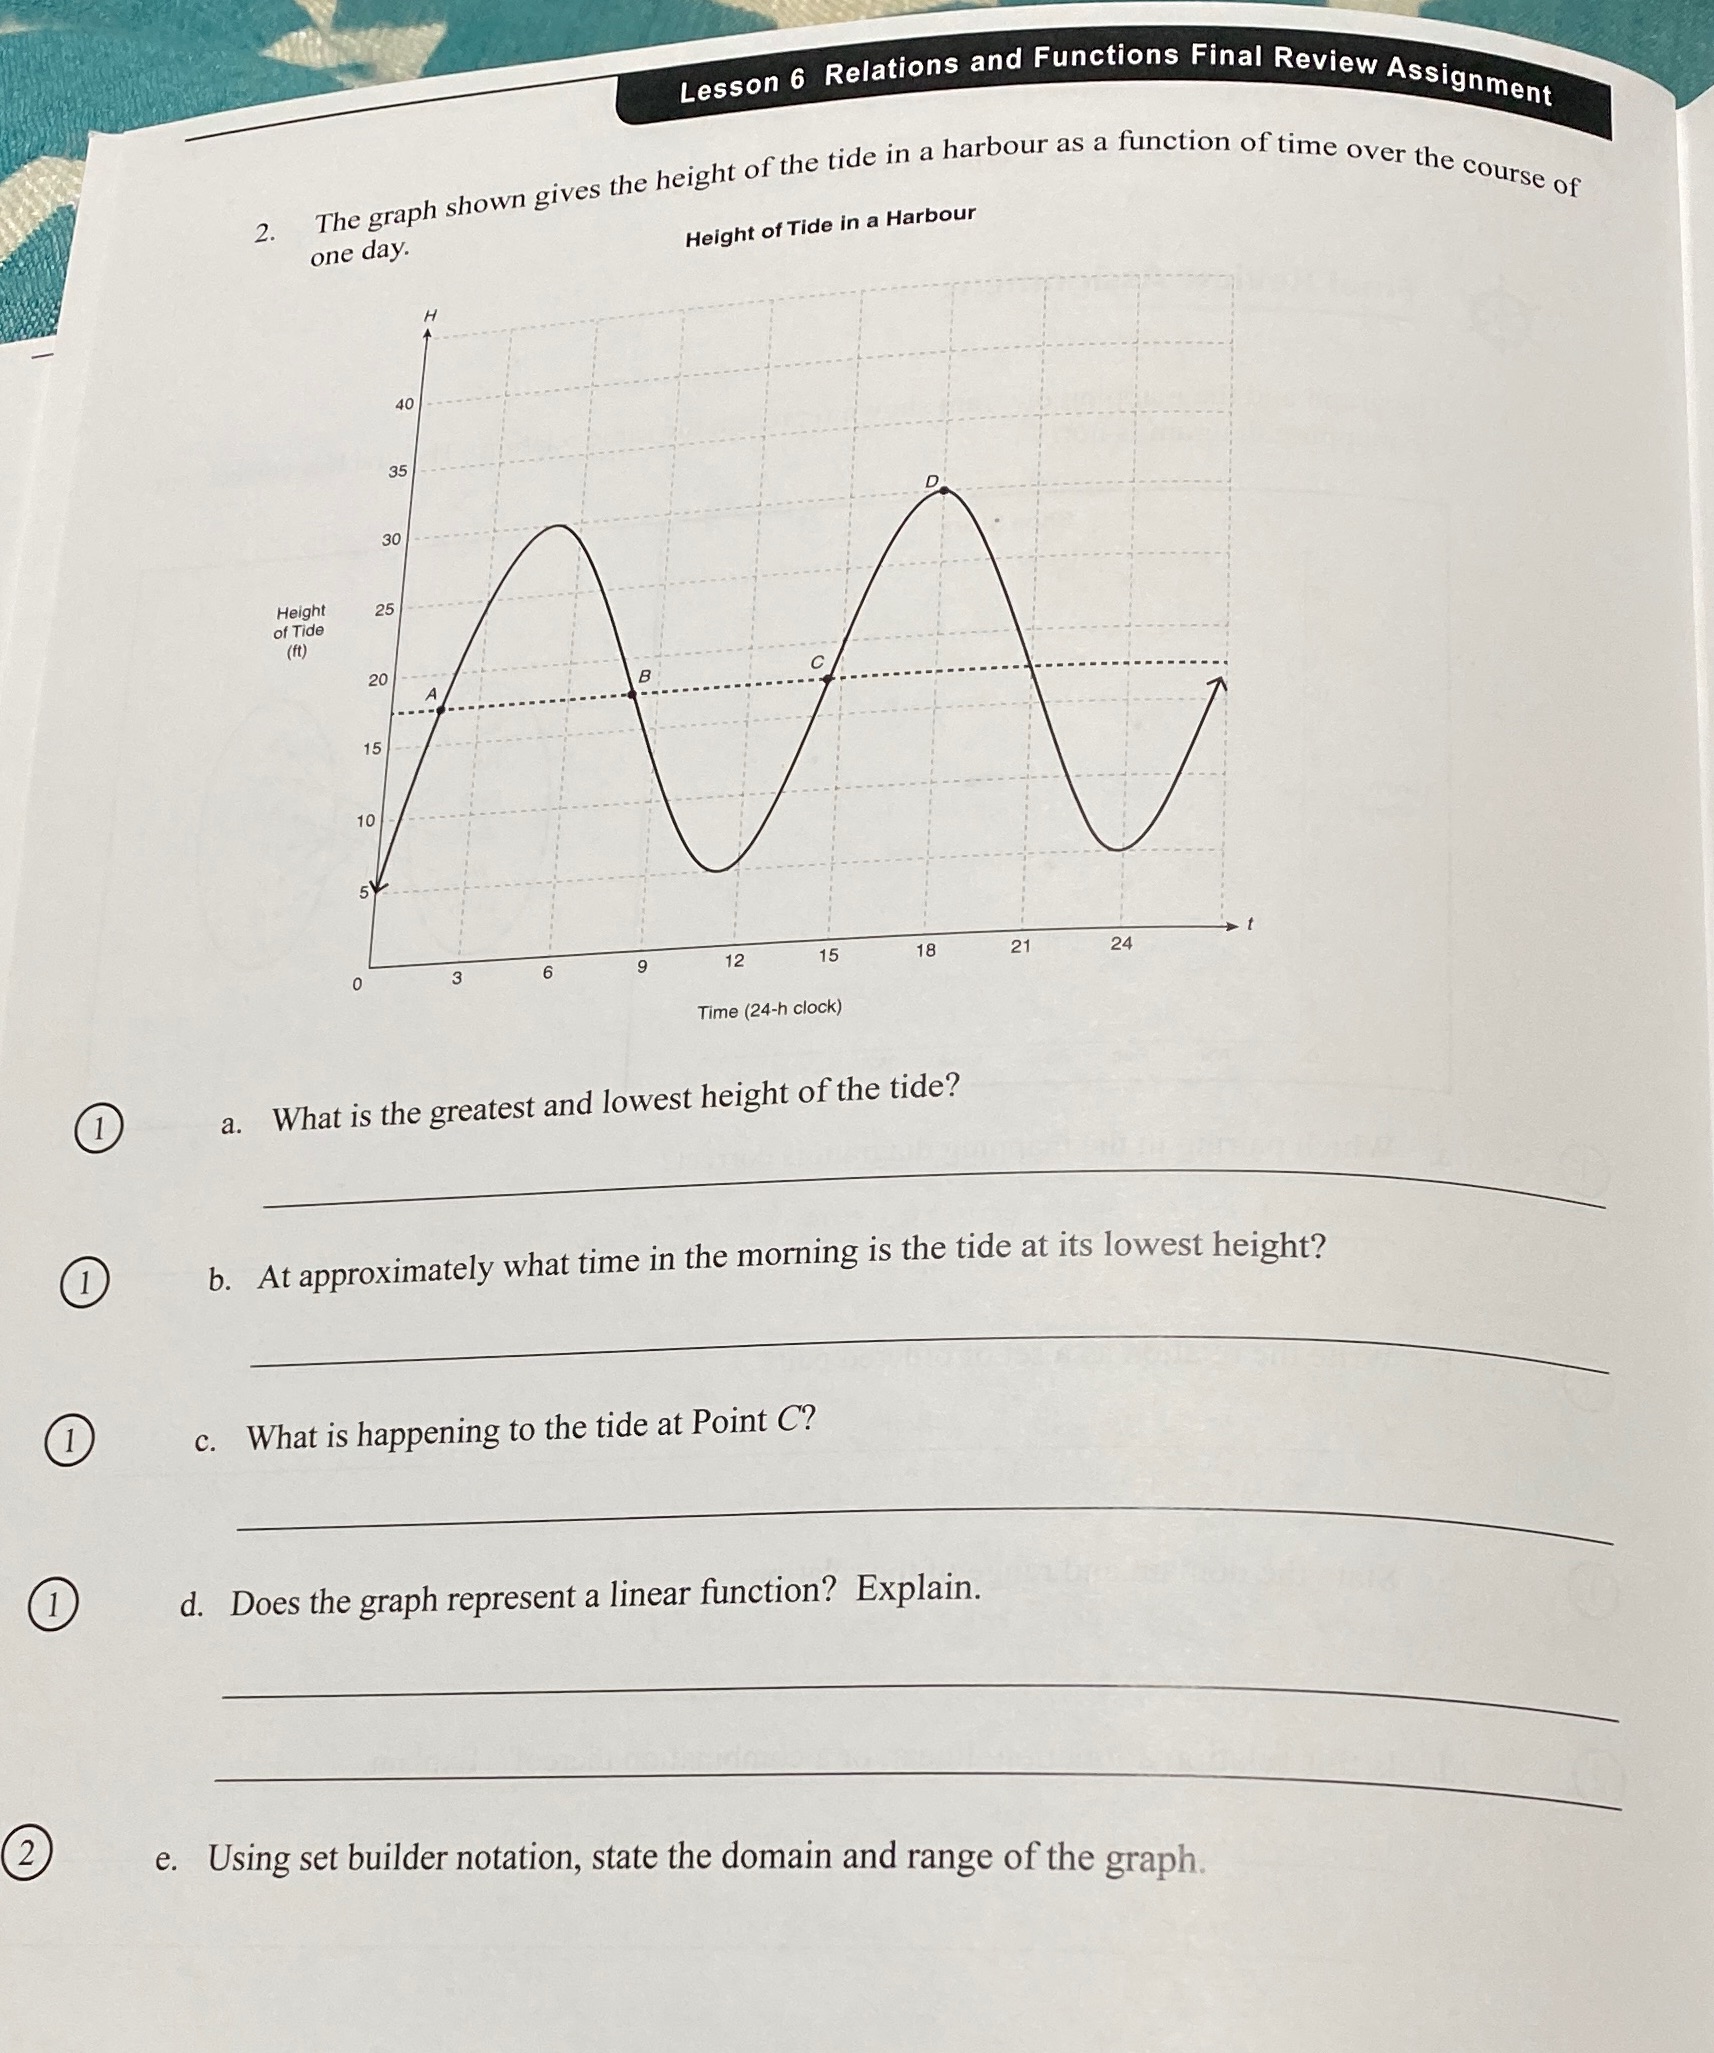
Lesson 6 Relations and Functions Final Review Assignment 2. The graph shown gives the height of the tide in a harbour as a function of time over the course of one day. Height of Tide in a Harbour 40 Height of Tide (ft) 10 9 12 15 18 21 24 Time (24-h clock) 1 a. What is the greatest and lowest height of the tide? 1 b. At approximately what time in the morning is the tide at its lowest height? 1 c. What is happening to the tide at Point C? 1 d. Does the graph represent a linear function? Explain. (2) e. Using set builder notation, state the domain and range of the graph
Step by Step Solution
There are 3 Steps involved in it
1 Expert Approved Answer
Step: 1 Unlock

Question Has Been Solved by an Expert!
Get step-by-step solutions from verified subject matter experts
Step: 2 Unlock
Step: 3 Unlock