

Question: Help me construct a graph, plotting the log of (r) against the log of [I-] please thankyou! log r = log(k) + m log [1-]
![the log of [I-] please thankyou! log r = log(k) + m](https://dsd5zvtm8ll6.cloudfront.net/si.experts.images/questions/2024/09/66f8493671eaf_70166f84935e12fc.jpg)
![log [1-] +n log [S2082-] Rearrange the above to reveal an equation](https://dsd5zvtm8ll6.cloudfront.net/si.experts.images/questions/2024/09/66f8493736eb8_70266f84936b0971.jpg)
Help me construct a graph, plotting the log of (r) against the log of [I-] please thankyou!
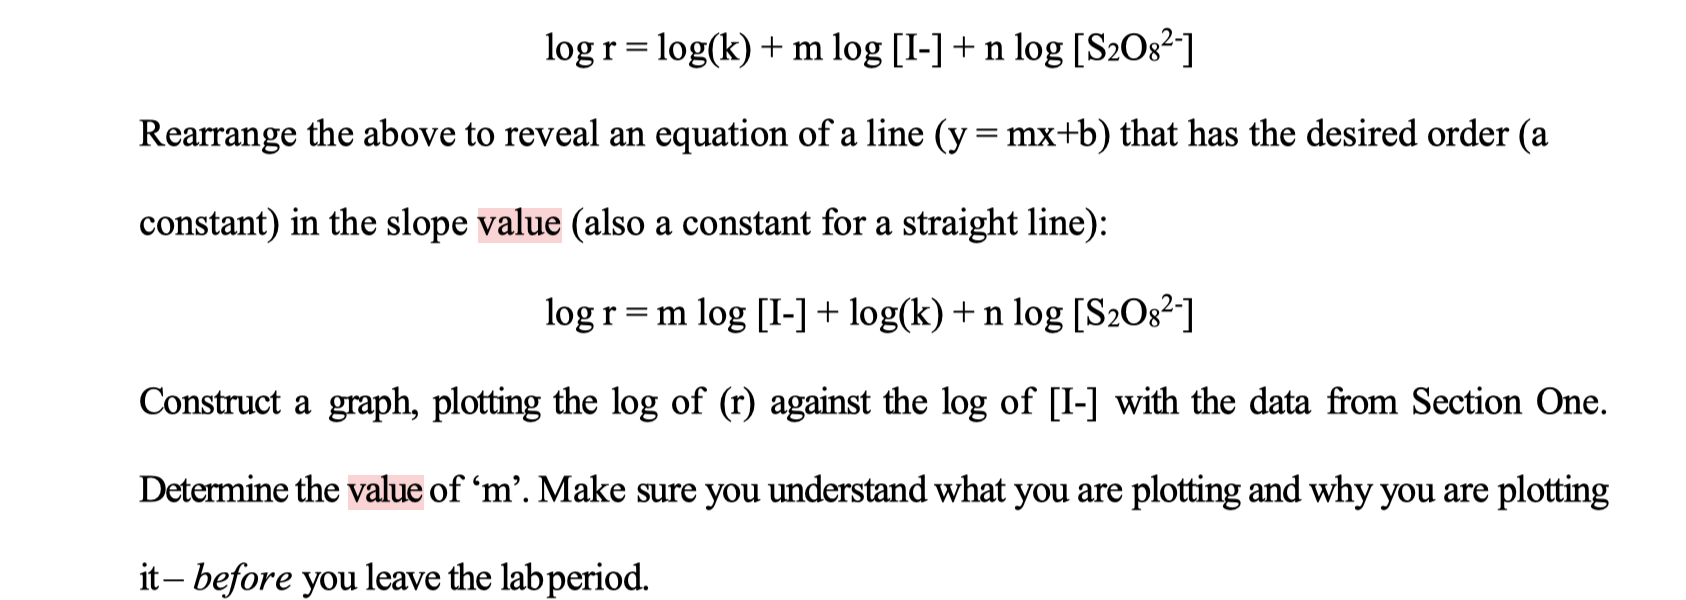
log r = log(k) + m log [1-] +n log [S2082-] Rearrange the above to reveal an equation of a line (y=mx+b) that has the desired order (a constant) in the slope value (also a constant for a straight line): logr=m log [I-] + log(k) + n log [S2082-1 = Construct a graph, plotting the log of (r) against the log of [I-) with the data from Section One. Determine the value of m. Make sure you understand what you are plotting and why you are plotting it, before you leave the labperiod. Section 1: Reaction Order with Respect to lodide lons: Table 1: Determination of Reaction Order with Respect to lodide lons DATA: A Flask B Vol 0.10M End Rxn Temp Exp't Flask A Vol # 0.20M KI Flask A Vol 0.20M KCL B Time to turn Temp blue (s) (C) Temp (C) 23 S2082- (C) 1.1 0.02 0.02 17 71.4 21 1.1 0.02 23 0.02 18 66.6 22 1.1 0.02 24 0.02 19 69 22 1.2 0.016 0.004 22.5 0.02 20 75 22.5 1.3 0.012 0.008 23 0.02 21.9 120.6 23.2 1.4 0.008 0.012 22 0.02 20 187.8 21.5 1.5 0.004 0.016 23 0.02 23 370.8 24 Concentration of Iodine (20.0 ml (0.20m z olm you w Section #1 3.85 Mis 1.4) loger) = log (1.4 x 10 M/S) = log (1.50 x16 = -3.82 M/S log (1.45 xlaya -3.84 MIS 1.2) -3.89 mis 1.3) Tag (8.29x10⁹) ) - 4.08 mis log (1.3 x 10" ) log 1.98 log (5.32 xlos) mets 1.5) log ( 2.7 X 15 3 ) mis ) - 4.27 ms -4.57 Mis log r = log(k) + m log [1-] +n log [S2082-] Rearrange the above to reveal an equation of a line (y=mx+b) that has the desired order (a constant) in the slope value (also a constant for a straight line): logr=m log [I-] + log(k) + n log [S2082-1 = Construct a graph, plotting the log of (r) against the log of [I-) with the data from Section One. Determine the value of m. Make sure you understand what you are plotting and why you are plotting it, before you leave the labperiod. Section 1: Reaction Order with Respect to lodide lons: Table 1: Determination of Reaction Order with Respect to lodide lons DATA: A Flask B Vol 0.10M End Rxn Temp Exp't Flask A Vol # 0.20M KI Flask A Vol 0.20M KCL B Time to turn Temp blue (s) (C) Temp (C) 23 S2082- (C) 1.1 0.02 0.02 17 71.4 21 1.1 0.02 23 0.02 18 66.6 22 1.1 0.02 24 0.02 19 69 22 1.2 0.016 0.004 22.5 0.02 20 75 22.5 1.3 0.012 0.008 23 0.02 21.9 120.6 23.2 1.4 0.008 0.012 22 0.02 20 187.8 21.5 1.5 0.004 0.016 23 0.02 23 370.8 24 Concentration of Iodine (20.0 ml (0.20m z olm you w Section #1 3.85 Mis 1.4) loger) = log (1.4 x 10 M/S) = log (1.50 x16 = -3.82 M/S log (1.45 xlaya -3.84 MIS 1.2) -3.89 mis 1.3) Tag (8.29x10⁹) ) - 4.08 mis log (1.3 x 10" ) log 1.98 log (5.32 xlos) mets 1.5) log ( 2.7 X 15 3 ) mis ) - 4.27 ms -4.57 Mis
Step by Step Solution
There are 3 Steps involved in it

Get step-by-step solutions from verified subject matter experts