

Question: construct Math for the LP Graph, an LP Graphic Solution, and a Profit Analysis Table for the following question: A furniture company produces three products:
construct Math for the LP Graph, an LP Graphic Solution, and a Profit Analysis Table for the following question:
A furniture company produces three products: end tables (T), sofas (S), and chairs (C). This furniture company wants to determine the product mix that will maximize profit. These products are processed in five departments: the saw lumber, fabric cutting, sanding, staining, and assembly departments. End tables and chairs are produced from raw lumber only, and the sofas require lumber and fabric. Glue and thread are plentiful and represent a relatively insignificant cost that is included in operating expenses. The specific requirements for each product are as follows:
Department Constraints Table:
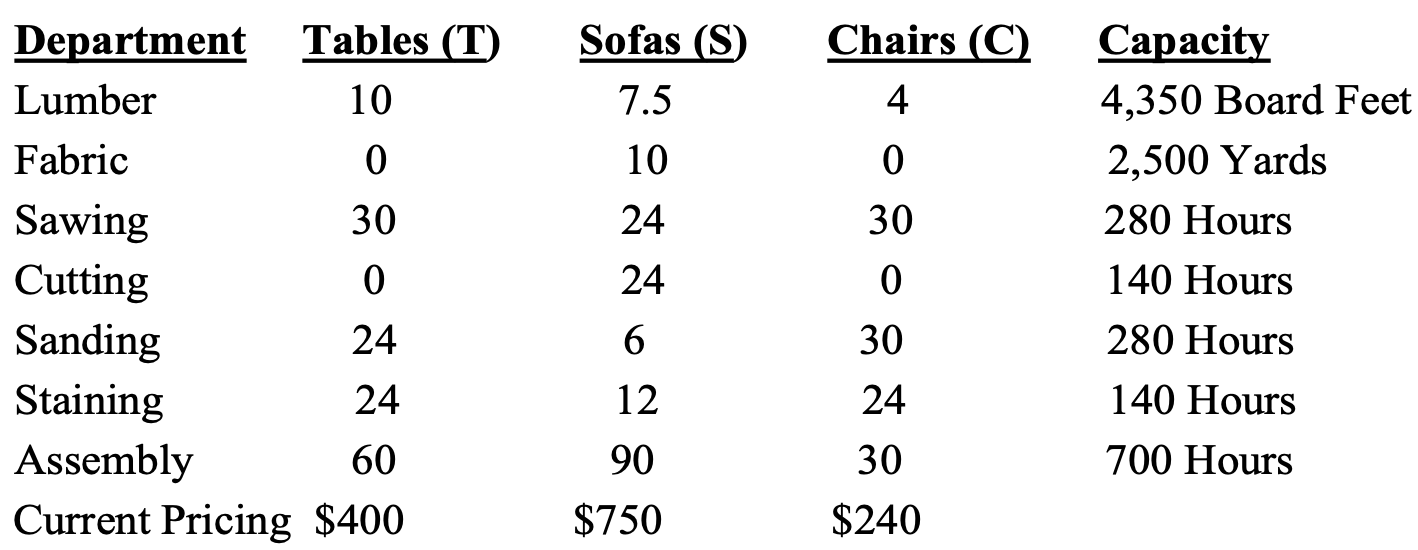
Department Tables (T) Lumber 10 Fabric 0 Sawing 30 Cutting 0 Sanding 24 Staining 24 Assembly 60 Current Pricing $400 Sofas (S) 7.5 10 24 24 6 12 90 $750 Chairs (C) 4 0 30 0 30 24 30 $240 Capacity 4,350 Board Feet 2,500 Yards 280 Hours 140 Hours 280 Hours 140 Hours 700 Hours
Step by Step Solution
3.37 Rating (156 Votes )
There are 3 Steps involved in it
To construct the LP graph LP graphic solution and profit analysis table we need to set up the objective function constraints and decision variables ba... View full answer

Get step-by-step solutions from verified subject matter experts