

Question: help me Create a market supply/demand graph on excel The graph will be a simple supply and demand graph of a market for pizza slices
help me Create a market supply/demand graph on excel The graph will be a simple supply and demand graph of a market for pizza slices on campus. Use the following data to create this graph:
1. Supply/Demand Data Table Price , Quantity Demanded, Quantity Supplied $4, 7 ,3 $6 6 4 $8 5 5 $10 4 6 $12 3 7
2. Then Update the graph: Now, say an advertising campaign is successful at changing consumer tastes/preferences. We now have a new market demand for pizza on campus! Use the following data to show the second demand curve on this graph: (label your second demand curve as D2)
Supply/Demand Data Table Price Quantity of Pizza Slices Demanded After Advertising $4 8 $6 7.5 $8 7 $10 6.5 $12 6
Answer the Questions based on the previous info.
1. Is the equilibrium price higher or lower after the shift? 2. Is demand more elastic or more inelastic after this successful advertising campaign?
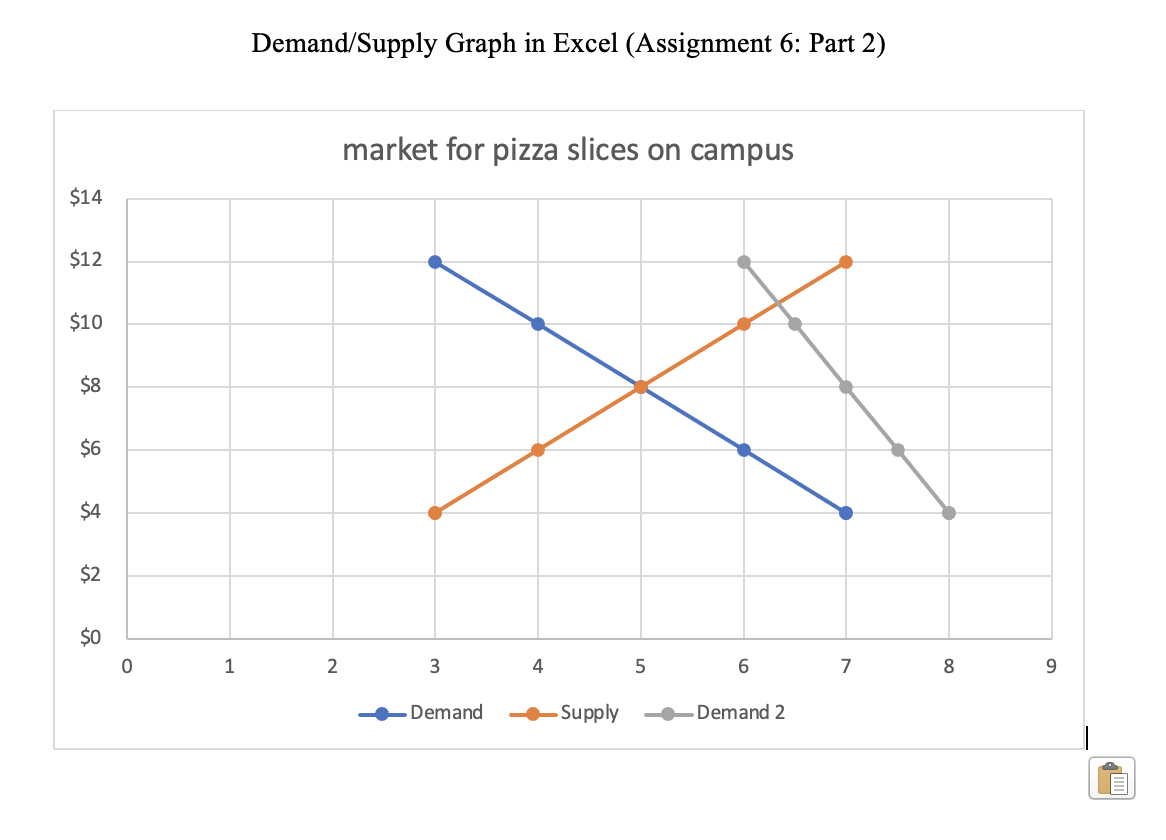
Demand/Supply Graph in Excel (Assignment 6: Part 2) market for pizza slices on campus 2 3 4 5 6 7 +Demand +Supply +Demand2
Step by Step Solution
There are 3 Steps involved in it

Get step-by-step solutions from verified subject matter experts