

Question: help me I. Graph: Amount Quantity Supplied Quantity Demanded Php10 15 490 Php20 130 390 Php30 250 280 Php40 360 185 Php50 485 80 1.
help me
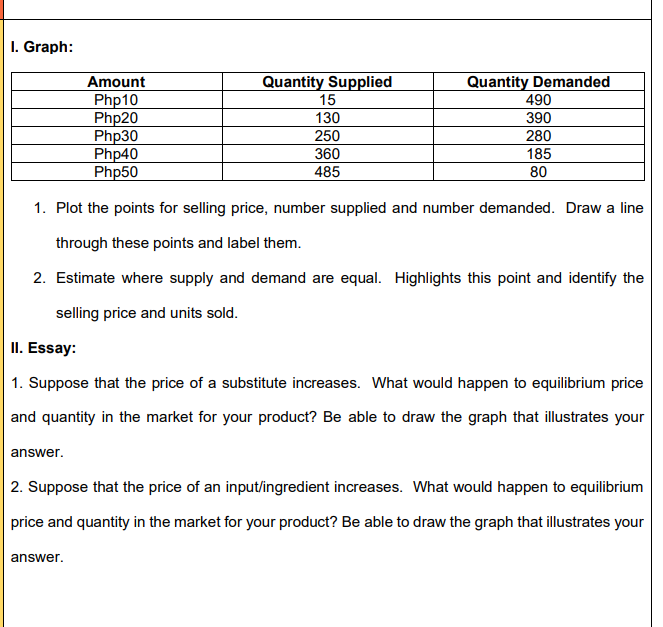
I. Graph: Amount Quantity Supplied Quantity Demanded Php10 15 490 Php20 130 390 Php30 250 280 Php40 360 185 Php50 485 80 1. Plot the points for selling price, number supplied and number demanded. Draw a line through these points and label them. 2. Estimate where supply and demand are equal. Highlights this point and identify the selling price and units sold. Il. Essay: 1. Suppose that the price of a substitute increases. What would happen to equilibrium price and quantity in the market for your product? Be able to draw the graph that illustrates your answer. 2. Suppose that the price of an input/ingredient increases. What would happen to equilibrium price and quantity in the market for your product? Be able to draw the graph that illustrates your
Step by Step Solution
There are 3 Steps involved in it

Get step-by-step solutions from verified subject matter experts