

Question: help me I. Graph: Amount Quantity Supplied Quantity Demanded Php10 15 490 Php20 130 390 Php30 250 280 Php40 360 185 Php50 485 80 1.
help me
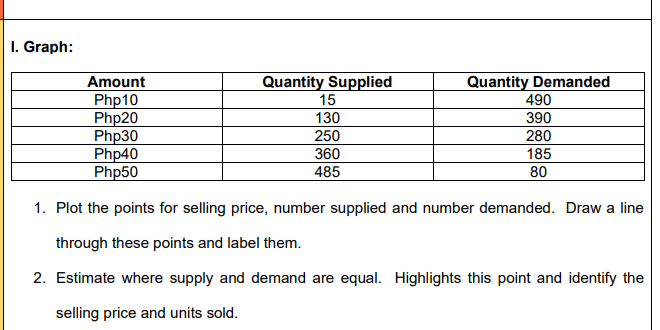
I. Graph: Amount Quantity Supplied Quantity Demanded Php10 15 490 Php20 130 390 Php30 250 280 Php40 360 185 Php50 485 80 1. Plot the points for selling price, number supplied and number demanded. Draw a line through these points and label them. 2. Estimate where supply and demand are equal. Highlights this point and identify the selling price and units sold
Step by Step Solution
There are 3 Steps involved in it
1 Expert Approved Answer
Step: 1 Unlock

Question Has Been Solved by an Expert!
Get step-by-step solutions from verified subject matter experts
Step: 2 Unlock
Step: 3 Unlock