

Question: help me in this problems The sample means and variances of the observed data are needed to find the values in the sum of squares
help me in this problems
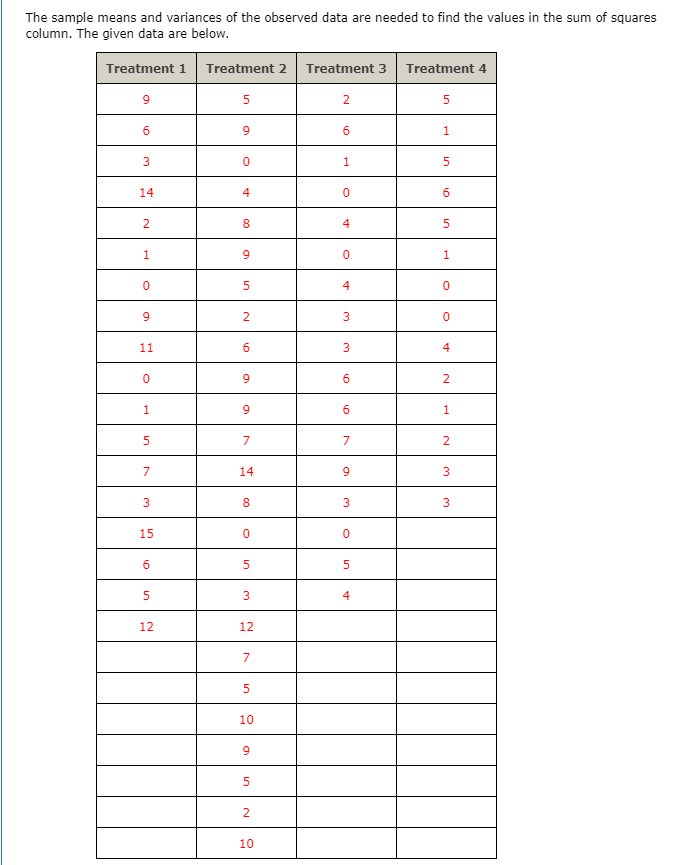
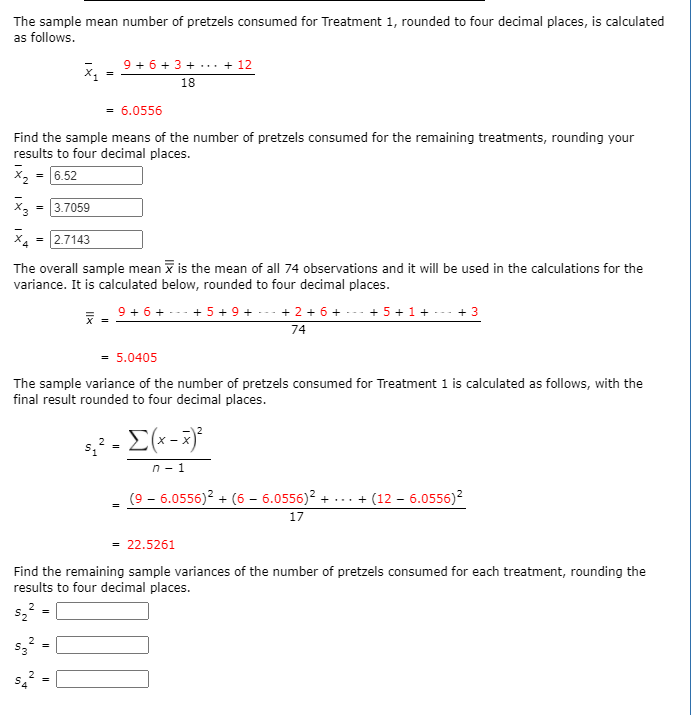
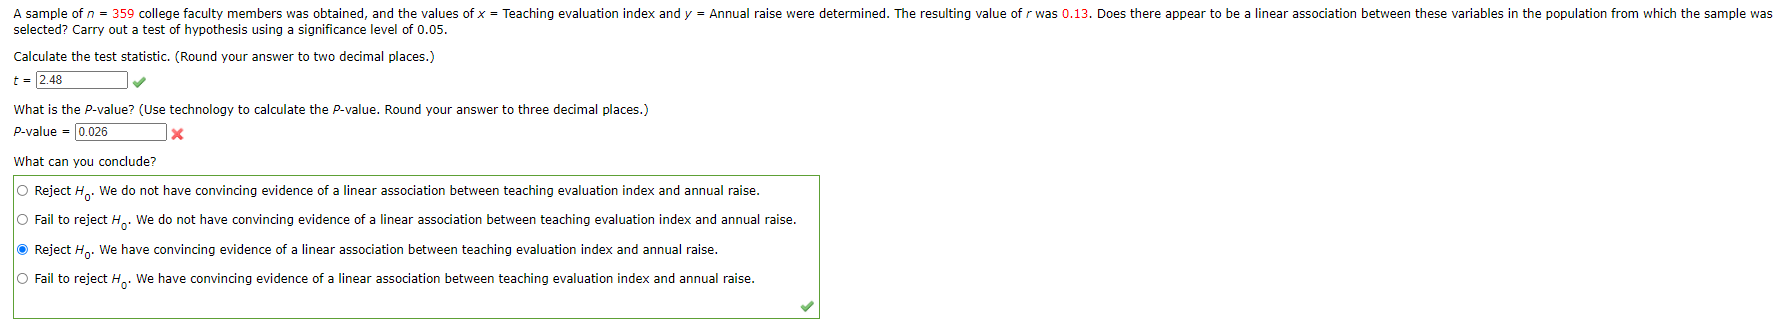
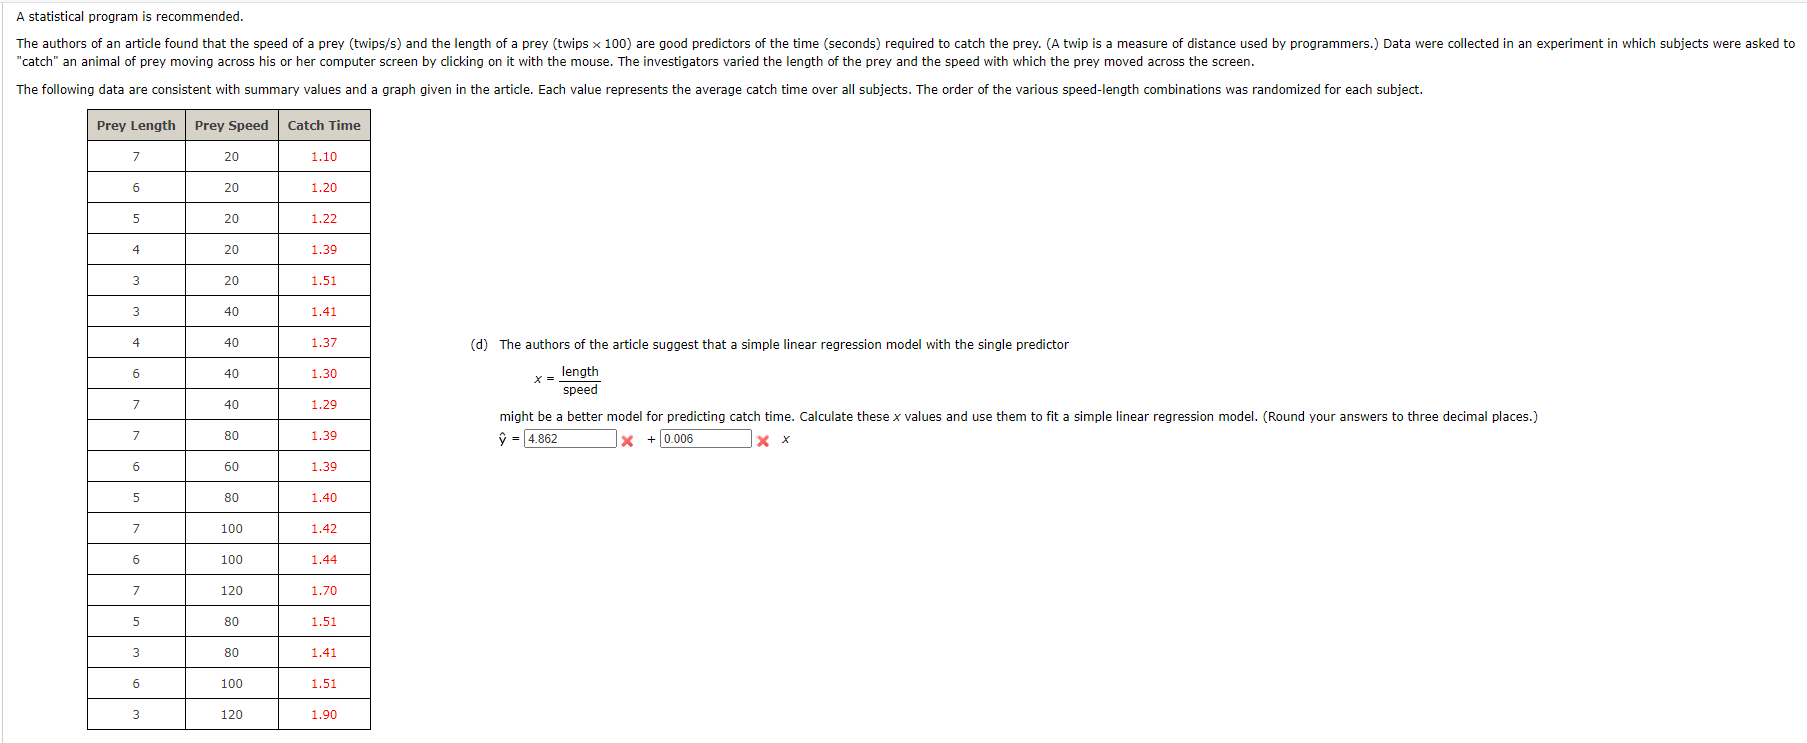
The sample means and variances of the observed data are needed to find the values in the sum of squares column. The given data are below. Treatment 1 Treatment 2 Treatment 3 Treatment 4 2 5 9 5 9 6 1 0 5 3 14 4 0 6 un CO N O LD O O W LD w 11 N 9 O 9 N 7 W 14 9 8 3 W w 15 0 0 6 5 5 3 4 12 12 7 10 LD 2 10The sample mean number of pretzels consumed for Treatment 1, rounded to four decimal places, is calculated as follows. x, _ 9+6+ 3+ ... + 12 18 = 6.0556 Find the sample means of the number of pretzels consumed for the remaining treatments, rounding your results to four decimal places. X2 = 6.52 X2 = 3.7059 XA = 2.7143 The overall sample mean x is the mean of all 74 observations and it will be used in the calculations for the variance. It is calculated below, rounded to four decimal places. X = 9+6+ ---+5+9+ ---+2+6+---+5+1+.--+. 74 = 5.0405 The sample variance of the number of pretzels consumed for Treatment 1 is calculated as follows, with the final result rounded to four decimal places. 2 E ( x - *)2 n - 1 (9 - 6.0556)2 + (6 - 6.0556)2 + ... + (12 - 6.0556)2 17 = 22.5261 Find the remaining sample variances of the number of pretzels consumed for each treatment, rounding the results to four decimal places. S -A sample of n = 359 college faculty members was obtained, and the values of x = Teaching evaluation index and y = Annual raise were determined. The resulting value of r was 0.13. Does there appear to be a linear association between these variables in the population from which the sample was selected? Carry out a test of hypothesis using a significance level of 0.05. Calculate the test statistic. (Round your answer to two decimal places.) t = 2.48 What is the P-value? (Use technology to calculate the P-value. Round your answer to three decimal places.) P-value = 0.026 1X What can you conclude? O Reject Ho. We do not have convincing evidence of a linear association between teaching evaluation index and annual raise. O Fail to reject Ho. We do not have convincing evidence of a linear association between teaching evaluation index and annual raise. Reject Ho. We have convincing evidence of a linear association between teaching evaluation index and annual raise. O Fail to reject H. We have convincing evidence of a linear association between teaching evaluation index and annual raise.A statistical program is recommended. The authors of an article found that the speed of a prey (twips/s) and the length of a prey (twips x 100) are good predictors of the time (seconds) required to catch the prey. (A twip is a measure of distance used by programmers.) Data were collected in an experiment in which subjects were asked to "catch" an animal of prey moving across his or her computer screen by clicking on it with the mouse. The investigators varied the length of the prey and the speed with which the prey moved across the screen. The following data are consistent with summary values and a graph given in the article. Each value represents the average catch time over all subjects. The order of the various speed-length combinations was randomized for each subject. Prey Length Prey Speed Catch Time 7 20 1.10 6 20 1.20 5 20 1.22 4 20 1.39 3 20 1.51 3 40 1.41 4 40 1.37 (d) The authors of the article suggest that a simple linear regression model with the single predictor 6 40 1.30 X = length 7 40 speed 1.29 7 80 1.39 = 4.862 might be a better model for predicting catch time. Calculate these x values and use them to fit a simple linear regression model. (Round your answers to three decimal places.) 1x + 0.006 x x 6 60 1.39 5 80 1.40 7 100 1.42 6 100 1.44 7 120 1.70 5 80 1.51 3 80 1.41 6 100 1.51 3 120 1.90
Step by Step Solution
There are 3 Steps involved in it

Get step-by-step solutions from verified subject matter experts