

Question: help me please 2. Consider the modified SIR model, ds dt = -b8212, dI = 65212 - k12. (a) Peak infection: i. Sketch a graph
help me please
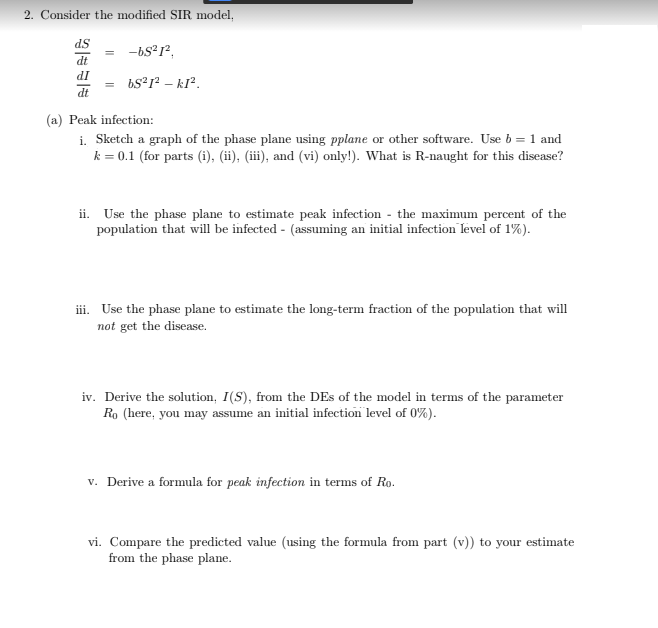
2. Consider the modified SIR model, ds dt = -b8212, dI = 65212 - k12. (a) Peak infection: i. Sketch a graph of the phase plane using pplane or other software. Use b = 1 and k = 0.1 (for parts (i), (ii), (iii), and (vi) only!). What is R-naught for this disease? ii. Use the phase plane to estimate peak infection - the maximum percent of the population that will be infected - (assuming an initial infection level of 1%). iii. Use the phase plane to estimate the long-term fraction of the population that will not get the disease. iv. Derive the solution, I($), from the DEs of the model in terms of the parameter Ro (here, you may assume an initial infection level of 0%). v. Derive a formula for peak infection in terms of Ro. vi. Compare the predicted value (using the formula from part (v)) to your estimate from the phase plane
Step by Step Solution
There are 3 Steps involved in it

Get step-by-step solutions from verified subject matter experts