

Question: help me please 6. Graphing Experimental Data and Interpretation of Data Graphs Use the pre-lab graph to answer questions a - c. Time (s) Concentration
help me please
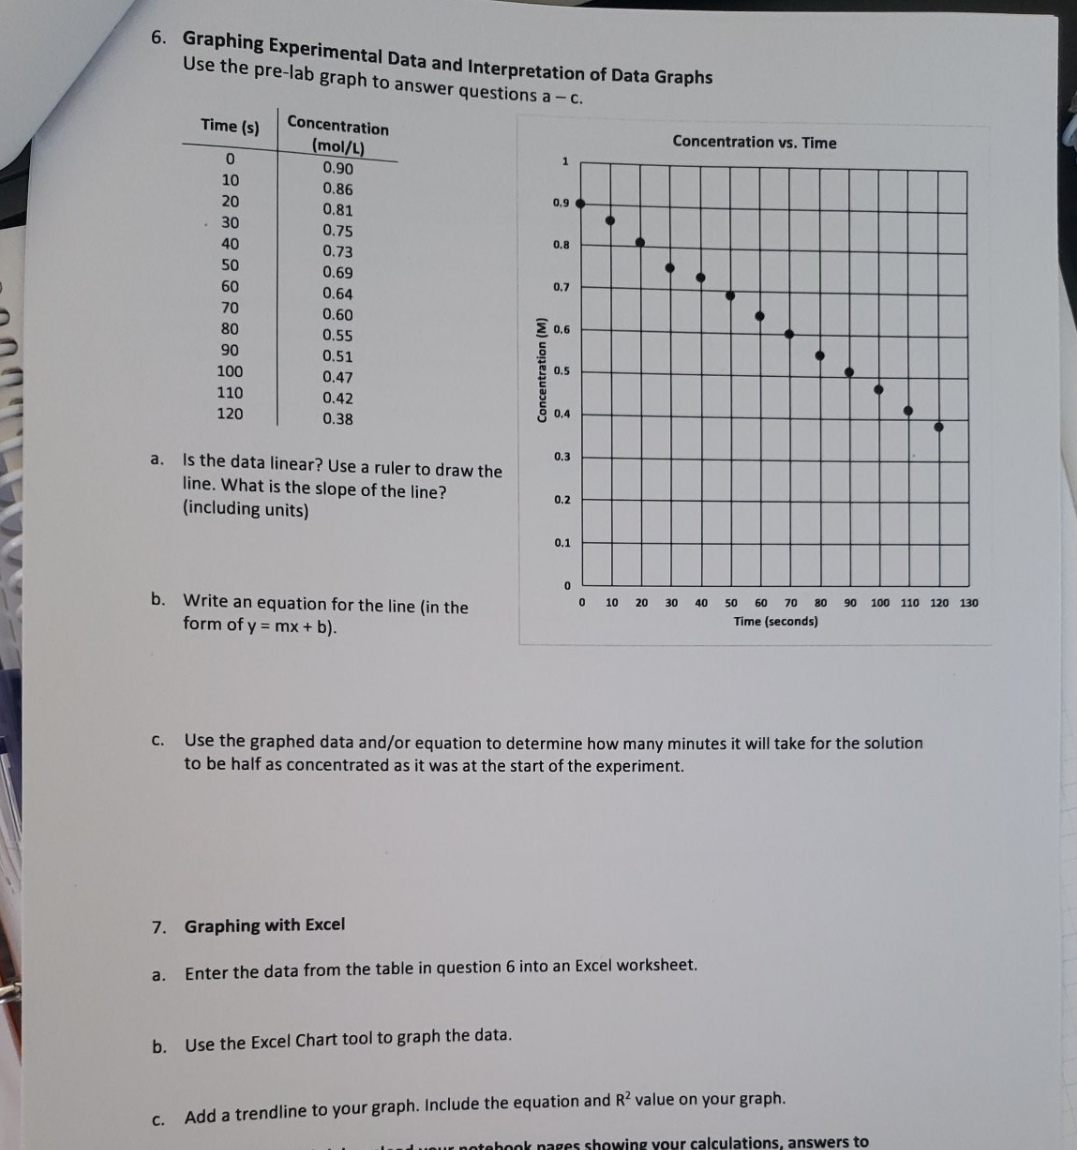
6. Graphing Experimental Data and Interpretation of Data Graphs Use the pre-lab graph to answer questions a - c. Time (s) Concentration Concentration vs. Time (mol/L) 0.90 10 0.86 0.9 20 0.81 30 ).75 0.8 40 0.73 50 0.69 0.7 60 0.64 70 0.60 0.6 80 0.55 90 0.51 Concentration ( 100 0.47 110 0.42 0.4 120 0.38 0.3 a. Is the data linear? Use a ruler to draw the line. What is the slope of the line? 0.2 (including units) 0.1 10 20 30 40 50 60 70 80 90 100 110 120 130 b. Write an equation for the line (in the Time (seconds) form of y = mx + b). C. Use the graphed data and/or equation to determine how many minutes it will take for the solution to be half as concentrated as it was at the start of the experiment. 7. Graphing with Excel a. Enter the data from the table in question 6 into an Excel worksheet. b. Use the Excel Chart tool to graph the data. c. Add a trendline to your graph. Include the equation and R2 value on your graph
Step by Step Solution
There are 3 Steps involved in it

Get step-by-step solutions from verified subject matter experts