

Question: help me please CENGAGE MINDTAP Module Three Quiz is developed that enables growers to produce more crops with the same resources. Show the effect this
help me please
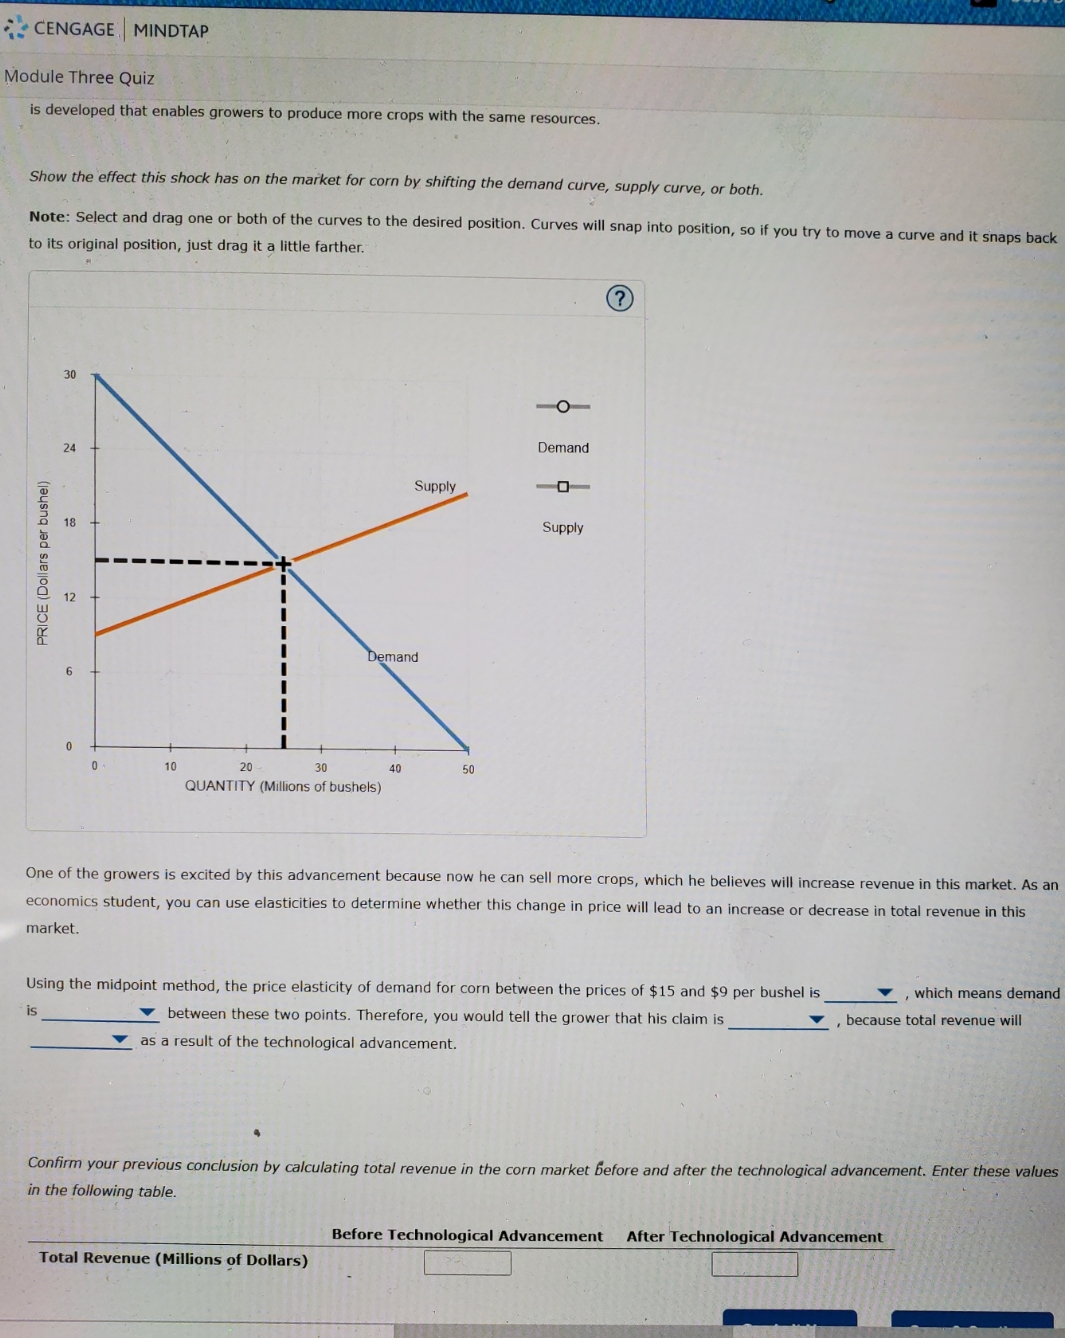
CENGAGE MINDTAP Module Three Quiz is developed that enables growers to produce more crops with the same resources. Show the effect this shock has on the market for corn by shifting the demand curve, supply curve, or both. Note: Select and drag one or both of the curves to the desired position. Curves will snap into position, so if you try to move a curve and it snaps back to its original position, just drag it a little farther. (? 30 24 Demand Supply -0- 18 Supply PRICE (Dollars per bushel) 12 Demand 6 10 20 30 40 50 QUANTITY (Millions of bushels) One of the growers is excited by this advancement because now he can sell more crops, which he believes will increase revenue in this market. As an economics student, you can use elasticities to determine whether this change in price will lead to an increase or decrease in total revenue in this market. Using the midpoint method, the price elasticity of demand for corn between the prices of $15 and $9 per bushel is_ , which means demand is between these two points. Therefore, you would tell the grower that his claim is , because total revenue will as a result of the technological advancement. Confirm your previous conclusion by calculating total revenue in the corn market before and after the technological advancement. Enter these values in the following table. Before Technological Advancement After Technological Advancement Total Revenue (Millions of Dollars)
Step by Step Solution
There are 3 Steps involved in it

Get step-by-step solutions from verified subject matter experts