

Question: Help me. Please explain in detail and clear format. 2) Now read the following data into R. Use R for all statistical procedures. Sample Sample
Help me. Please explain in detail and clear format.
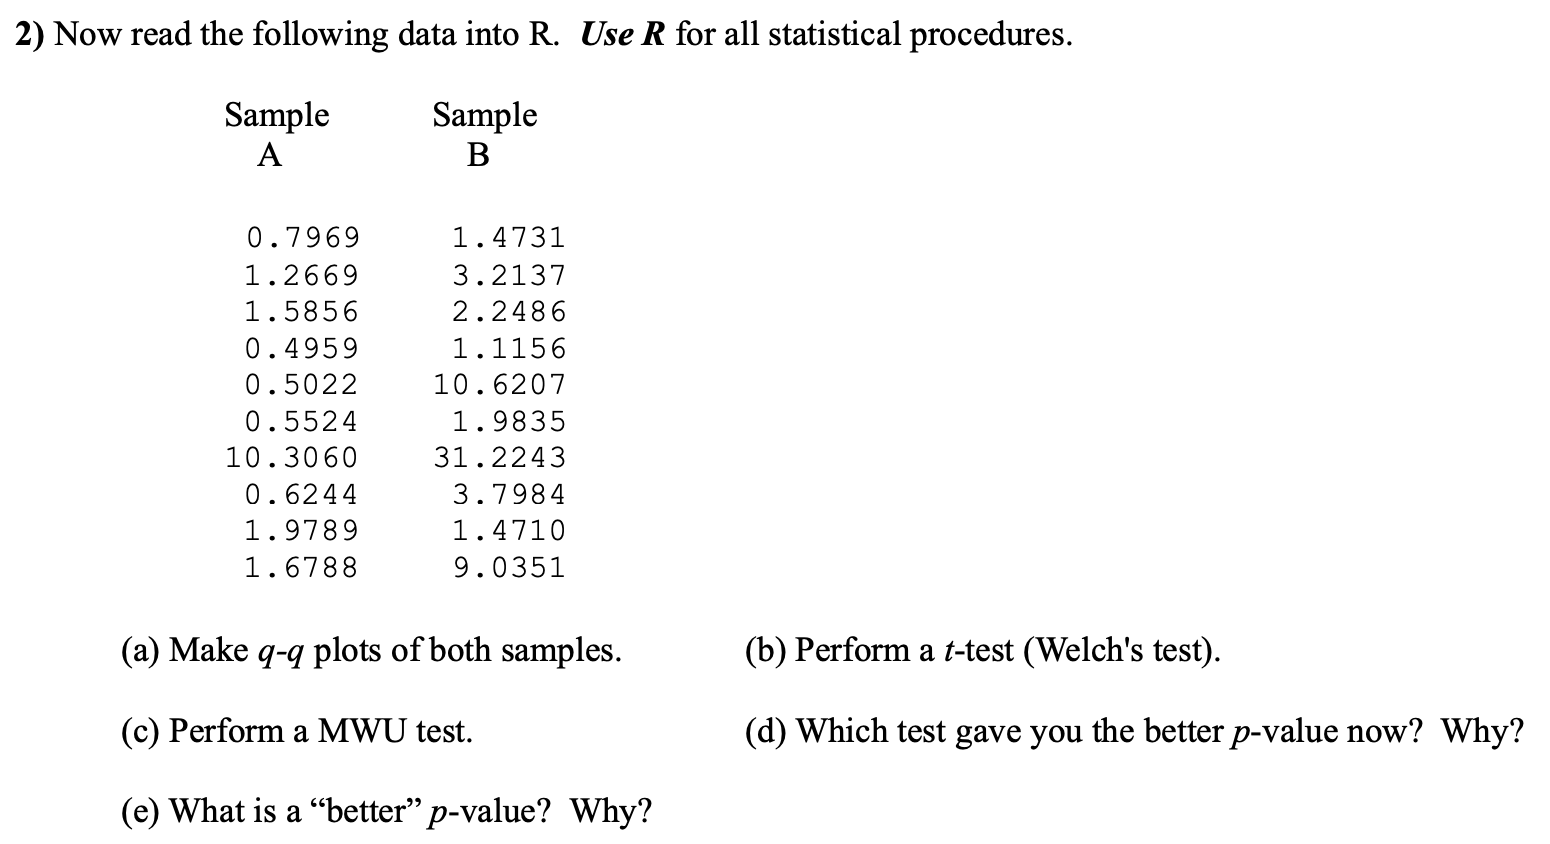
2) Now read the following data into R. Use R for all statistical procedures. Sample Sample A B 0. 7969 1 . 4731 1 . 2669 3 . 2137 1 . 5856 2 . 2486 0 . 4959 1 . 1156 0 . 5022 10 . 6207 0 . 5524 1. 9835 10 . 3060 31 . 2243 0 . 6244 3 . 7984 1 . 9789 1 . 4710 1 . 6788 9 . 0351 (a) Make q-q plots of both samples. (b) Perform a t-test (Welch's test). (c) Perform a MWU test. (d) Which test gave you the better p-value now? Why? (e) What is a "better" p-value? Why
Step by Step Solution
There are 3 Steps involved in it
1 Expert Approved Answer
Step: 1 Unlock

Question Has Been Solved by an Expert!
Get step-by-step solutions from verified subject matter experts
Step: 2 Unlock
Step: 3 Unlock