

Question: help me please Problem 2. Hypothesis testing on independence of two categorical variables in survey data (25 pts) Using the data in Problem 1, we
help me please
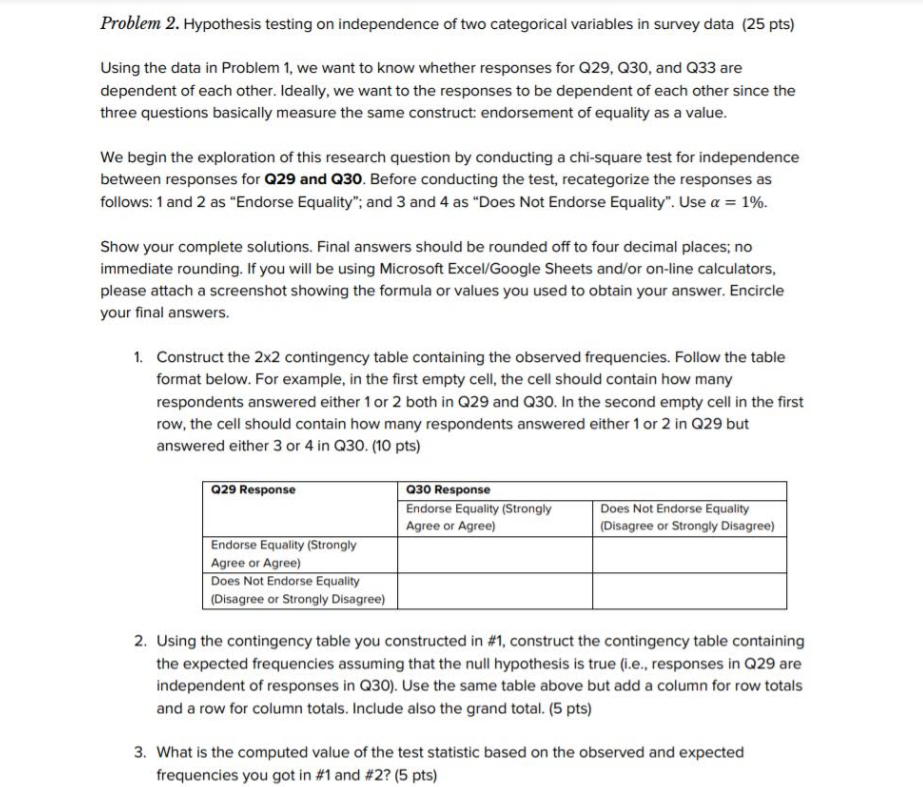
Problem 2. Hypothesis testing on independence of two categorical variables in survey data (25 pts) Using the data in Problem 1, we want to know whether responses for Q29, Q30, and Q33 are dependent of each other. Ideally, we want to the responses to be dependent of each other since the three questions basically measure the same construct: endorsement of equality as a value. We begin the exploration of this research question by conducting a chi-square test for independence between responses for Q29 and Q30. Before conducting the test, recategorize the responses as follows: 1 and 2 as "Endorse Equality"; and 3 and 4 as "Does Not Endorse Equality". Use a = 1%. Show your complete solutions. Final answers should be rounded off to four decimal places; no immediate rounding. If you will be using Microsoft Excel/Google Sheets and/or on-line calculators, please attach a screenshot showing the formula or values you used to obtain your answer. Encircle your final answers. 1. Construct the 2x2 contingency table containing the observed frequencies. Follow the table format below. For example, in the first empty cell, the cell should contain how many respondents answered either 1 or 2 both in Q29 and Q30. In the second empty cell in the first row, the cell should contain how many respondents answered either 1 or 2 in Q29 but answered either 3 or 4 in Q30. (10 pts) Q29 Response Q30 Response Endorse Equality (Strongly Does Not Endorse Equality Agree or Agree) (Disagree or Strongly Disagree) Endorse Equality (Strongly Agree or Agree) Does Not Endorse Equality (Disagree or Strongly Disagree) 2. Using the contingency table you constructed in #1, construct the contingency table containing the expected frequencies assuming that the null hypothesis is true (i.e., responses in Q29 are independent of responses in Q30). Use the same table above but add a column for row totals and a row for column totals. Include also the grand total. (5 pts) 3. What is the computed value of the test statistic based on the observed and expected frequencies you got in #1 and #2? (5 pts)
Step by Step Solution
There are 3 Steps involved in it

Get step-by-step solutions from verified subject matter experts