

Question: Help me please to complete the chart and let me know if I am correct with my answers LAB EXERCISE C3 - DESCRIPTIVE STATISTICS LAB
Help me please to complete the chart and let me know if I am correct with my answers
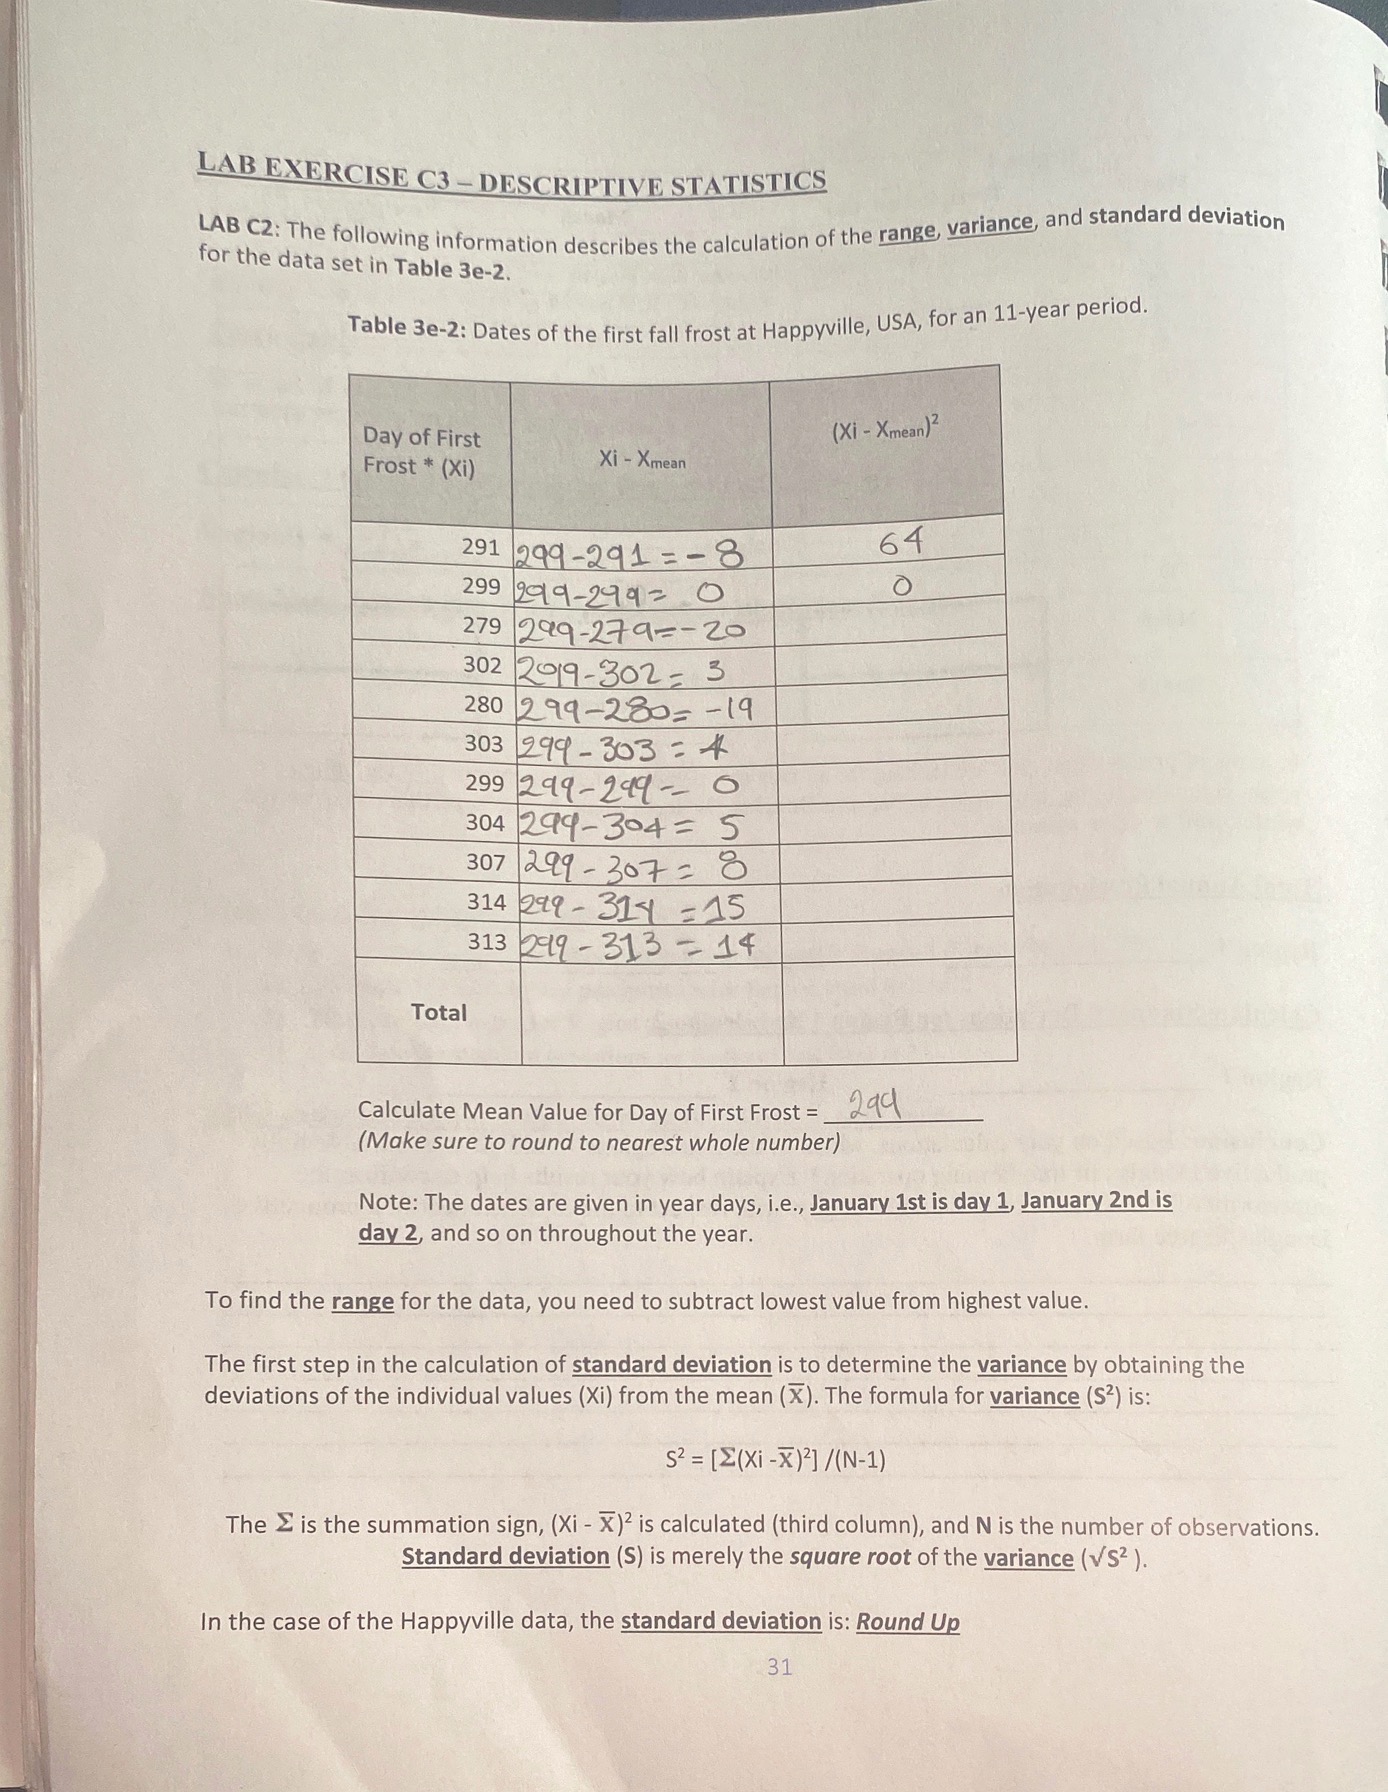
LAB EXERCISE C3 - DESCRIPTIVE STATISTICS LAB C2: The following information describes the calculation of the range, variance, and standard deviation for the data set in Table 3e-2. Table 3e-2: Dates of the first fall frost at Happyville, USA, for an 11-year period. Day of First (Xi - Xmean)2 Frost * (Xi) Xi - Xmean 299- 291 = - 8 64 299 2919 - 29 2 0 279 299- 279 - - 20 302 2919 - 302 = 3 280 299- 280= - 19 303 299 - 303 = 4 299 299 - 249 - O 304 299- 304 = 5 307 299 - 307 = 0 314 299 - 31-1 = 15 313 299 - 313 = 14 Total Calculate Mean Value for Day of First Frost = _ 299 (Make sure to round to nearest whole number) Note: The dates are given in year days, i.e., January 1st is day 1, January 2nd is day 2, and so on throughout the year. To find the range for the data, you need to subtract lowest value from highest value. The first step in the calculation of standard deviation is to determine the variance by obtaining the deviations of the individual values (Xi) from the mean (X). The formula for variance ($2) is: $2 = [E(Xi - x )2] / (N-1) The E is the summation sign, (Xi - X) is calculated (third column), and N is the number of observations. Standard deviation (S) is merely the square root of the variance (VS2 ). In the case of the Happyville data, the standard deviation is: Round Up 31
Step by Step Solution
There are 3 Steps involved in it

Get step-by-step solutions from verified subject matter experts