

Question: Help me Q. 41 Match the graphs between the following variables with their names. 105 Graphs Pressure vs temperature graph at constant molar volume Names
 Help me
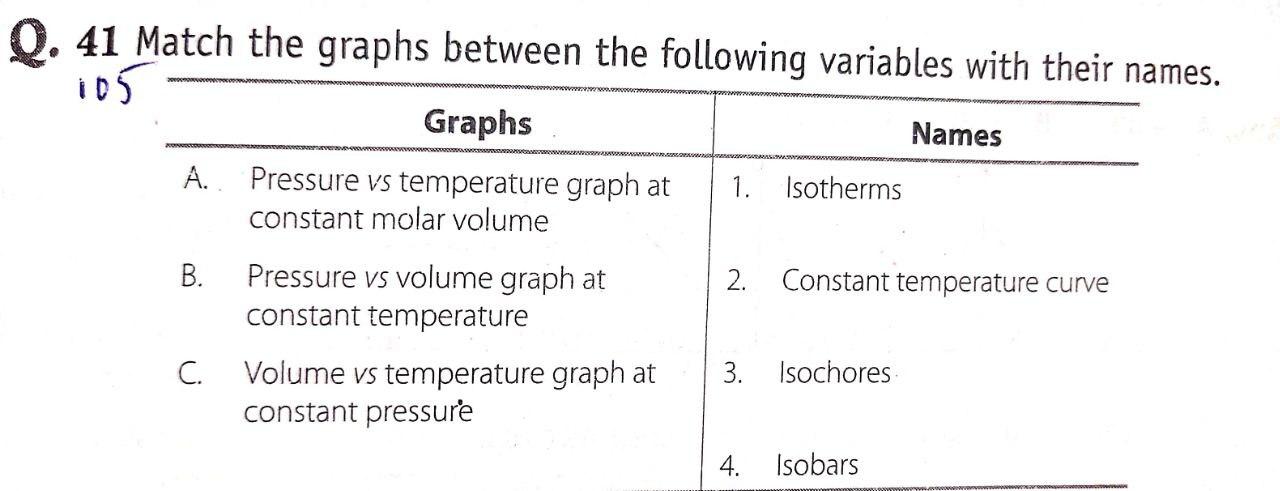
Q. 41 Match the graphs between the following variables with their names. 105 Graphs Pressure vs temperature graph at constant molar volume Names A. 1. Isotherms B. 2. Constant temperature curve Pressure vs volume graph at constant temperature Volume vs temperature graph at constant pressure C. 3. Isochores 4. Isobars
Step by Step Solution
There are 3 Steps involved in it
1 Expert Approved Answer
Step: 1 Unlock

Question Has Been Solved by an Expert!
Get step-by-step solutions from verified subject matter experts
Step: 2 Unlock
Step: 3 Unlock