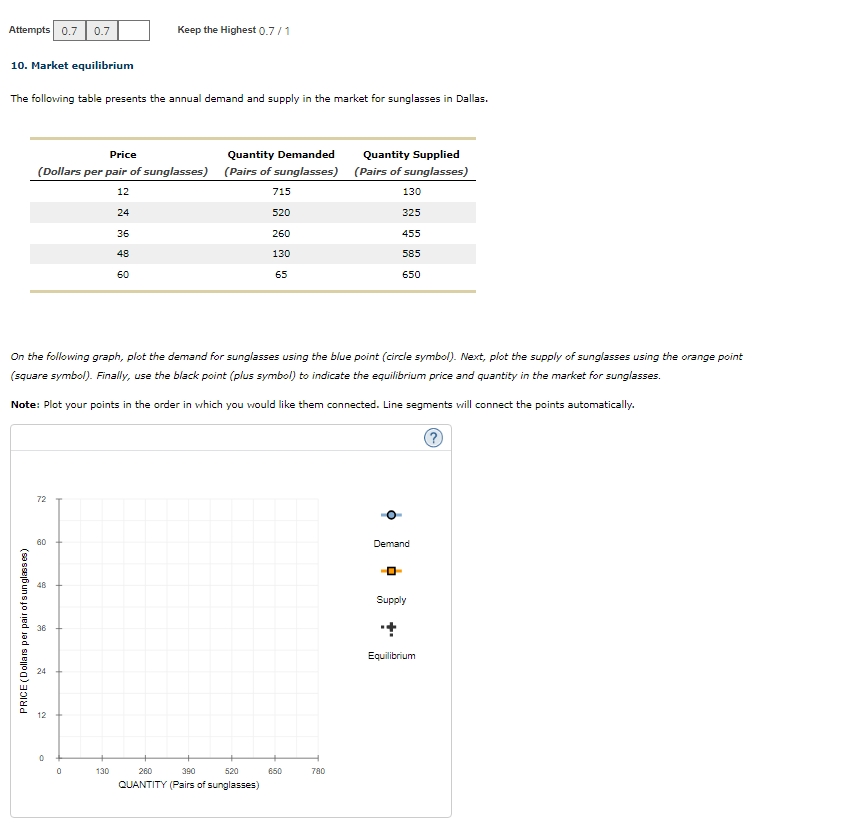
Question: help me slove answer Attempts | 0.7 0.7 Keep the Highest 0.7 / 1 10. Market equilibrium The following table presents the annual demand and

help me slove answer

help me slove answer Attempts | 0.7 0.7 Keep the
Attempts | 0.7 0.7 Keep the Highest 0.7 / 1 10. Market equilibrium The following table presents the annual demand and supply in the market for sunglasses in Dallas. Price Quantity Demanded Quantity Supplied ( Dollars per pair of sunglasses) (Pairs of sunglasses) (Pairs of sunglasses) 12 715 130 24 520 325 36 260 455 48 130 585 65 650 On the following graph, plot the demand for sunglasses using the blue point (circle symbol). Next, plot the supply of sunglasses using the orange point (square symbol). Finally, use the black point (plus symbol) to indicate the equilibrium price and quantity in the market for sunglasses. Note: Plot your points in the order in which you would like them connected. Line segments will connect the points automatically. 72 60 Demand -O- Supply 36 .+ PRICE (Dollars per pair of sunglasses) Equilibrium N 12 130 260 390 520 650 780 QUANTITY (Pairs of sunglasses)

Step by Step Solution

There are 3 Steps involved in it

1 Expert Approved Answer
Step: 1 Unlock blur-text-image
Question Has Been Solved by an Expert!

Get step-by-step solutions from verified subject matter experts

Step: 2 Unlock
Step: 3 Unlock

Students Have Also Explored These Related Business Writing Questions!